6.4 NH3 Emission Summaries and Analysis
Total NH3 emissions from agricultural land and non-agricultural land (biogenic emissions from soil and vegetation) were similar to the NEI 2020 total emissions (1.8 million tons), also yielding reported emissions of 1.8 million tons. The spatial distribution of NEI 2023 NEI emissions was also broadly similar to NEI 2020 with greatest emissions in the Great Plains and in Western U.S. (Figure 6.5). In comparison to the 2020 NEI, 2023 NEI emissions increased by less than 20 percent in the South-East, Mississippi Basin and Pacific Northwest (Figure 6.6). For the Southwest, Rockies and Northeast regions of the U.S. NEI 2023 emissions generally decreased by up to 20 percent in comparison to 2020 (Figure 6.6).
Total emission contributions were 59 percent (1.1 million tons) for agricultural lands and 41 percent (0.7 million tons) for non-agricultural land. The distribution of emissions between agricultural and non-agricultural sources is uncertain due to a lack of observational constraints, especially in non-agricultural areas. Emissions from agricultural land were generally highest in the Mid-West with hot spots in agricultural cropland counties (Figure 6.7). Our inventory doesn’t represent the role of livestock as a source of soil nitrogen. However, bi-directional exchange is likely a negligible contributor to NH3 emissions from livestock overall (inferred from results at the Wendell site in [ref 16]). Non-agricultural land emissions are generally highest in the Great Plains and western portion of the U.S. with hotspots in the Nebraska Sandhills, Southern California and Arizona and South Florida (Figure 6.8). For the Nebraska Sandhills, the emissions are likely driven by the local soil biogeochemistry, which has a strong potential for emitting NH3 because it is both sandy and alkaline. Additional measurements over this region and/or similar soils could provide evidence for refining the model representation of this process. Additionally, there is not currently a feedback mechanism for deposited nitrogen to contribute to emissions in later time steps. This may be influential in areas where deposition is a large contributor to total soil nitrogen.
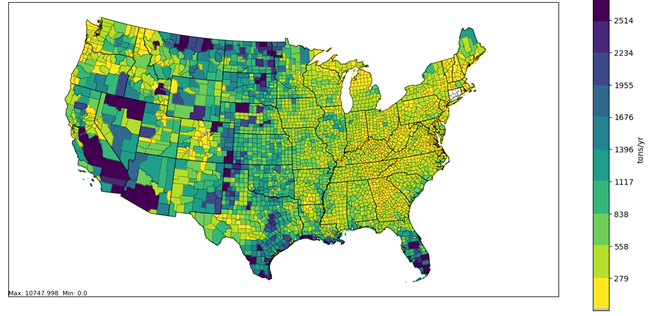
Figure 6.5: Distribution of total agricultural land NH3 emissions and non-agricultural land NH3 emissions (biogenic emissions from soil and vegetation) in the 2023 NEI
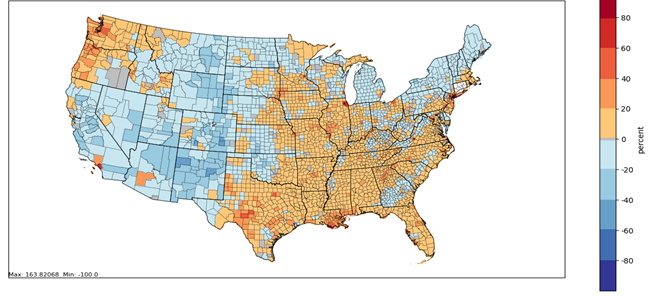
Figure 6.6: Percent difference between NEI 2023 and NEI 2020 total agricultural land NH3 emissions and non-agricultural land NH3 emissions (biogenic emissions from soil and vegetation)
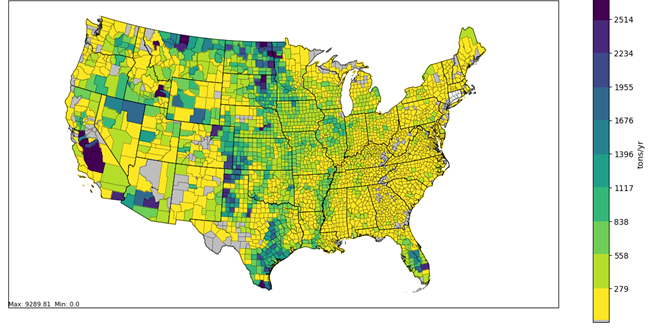
Figure 6.7: Distribution of NH3 emissions from agricultural land in the 2023 NEI
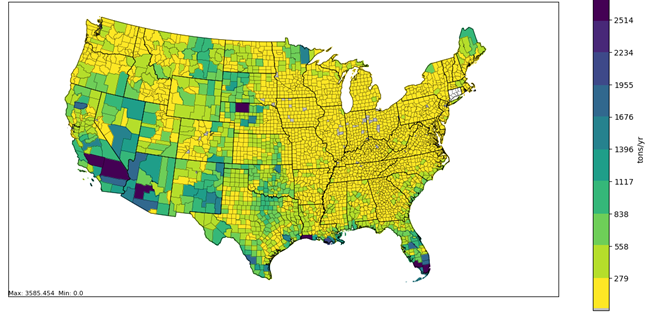
Figure 6.8: Distribution of non-agricultural land NH3 emissions (biogenic emissions from soil and vegetation) in the 2023 NEI