13.5 Emissions methodology and information
13.5.1 Source Classification Codes
Table 13.3 lists the new Source Classification Codes (SCCs) that define the different types of WLFs in the 2023 NEI. There are new SCCs by forest regions (e.g. Eastern, Boreal, Shrubland, etc.) added to this NEI. These new SCCs will enable improved chemical speciation in future Emissions Modeling Platforms (EMPs) used in air quality modeling simulations. The new SCCs also include separate codes for Coarse Woody Debris (CWD) and duff fuels. A new SCC 2811016000 was added to support the new method for estimating emissions from pile burns. Note that we continue to include a specific SCC (2801500170) that houses the grassland fires of “Flint Hills,” which occur over much of eastern Kansas and a small part of eastern Oklahoma. In addition, other grassland fires (other than “Flint Hills” fires) are processed via the SmartFire2/BlueSky Pipeline (SF2/BSP) process described below and inventoried along with other wildland fires.
| Source Classification Code (SCC) | Status | SCC Description |
|---|---|---|
| 2801500171 | No change in 2023NEI | Grass/Fallow; Flint Hills Prescribed Burning; Flaming |
| 2810070001 | New in 2023NEI | Other Combustion; Boreal Forest Wildfires; Smoldering + Flaming |
| 2810070002 | New in 2023NEI | Other Combustion; Boreal Forest Wildfires; CWD Residual Smoldering |
| 2810070003 | New in 2023NEI | Other Combustion; Boreal Forest Wildfires; Duff Residual Smoldering |
| 2810071001 | New in 2023NEI | Other Combustion; Eastern Forest Wildfires; Smoldering + Flaming |
| 2810071002 | New in 2023NEI | Other Combustion; Eastern Forest Wildfires; CWD Residual Smoldering |
| 2810071003 | New in 2023NEI | Other Combustion; Eastern Forest Wildfires; Duff Residual Smoldering |
| 2810072001 | New in 2023NEI | Other Combustion; Grassland Wildfires; Smoldering + Flaming |
| 2810073001 | New in 2023NEI | Other Combustion; Shrubland Wildfires; Smoldering + Flaming |
| 2810073002 | New in 2023NEI | Other Combustion; Shrubland Wildfires; CWD Residual Smoldering |
| 2810073003 | New in 2023NEI | Other Combustion; Shrubland Wildfires; Duff Residual Smoldering |
| 2810074001 | New in 2023NEI | Other Combustion; Western Forest Wildfires; Smoldering + Flaming |
| 2810074002 | New in 2023NEI | Other Combustion; Western Forest Wildfires; CWD Residual Smoldering |
| 2810074003 | New in 2023NEI | Other Combustion; Western Forest Wildfires; Duff Residual Smoldering |
| 2810080001 | New in 2023NEI | Other Combustion; Boreal Forest Prescribed Burning; Smoldering + Flaming |
| 2810080002 | New in 2023NEI | Other Combustion; Boreal Forest Prescribed Burning; CWD Residual Smoldering |
| 2810080003 | New in 2023NEI | Other Combustion; Boreal Forest Prescribed Burning; Duff Residual Smoldering |
| 2810081001 | New in 2023NEI | Other Combustion; Eastern Forest Prescribed Burning; Smoldering + Flaming |
| 2810081002 | New in 2023NEI | Other Combustion; Eastern Forest Prescribed Burning; CWD Residual Smoldering |
| 2810081003 | New in 2023NEI | Other Combustion; Eastern Forest Prescribed Burning; Duff Residual Smoldering |
| 2810082001 | New in 2023NEI | Other Combustion; Grassland Prescribed Burning; Smoldering + Flaming |
| 2810083001 | New in 2023NEI | Other Combustion; Shrubland Prescribed Burning; Smoldering + Flaming |
| 2810083002 | New in 2023NEI | Other Combustion; Shrubland Prescribed Burning; CWD Residual Smoldering |
| 2810083003 | New in 2023NEI | Other Combustion; Shrubland Prescribed Burning; Duff Residual Smoldering |
| 2810084001 | New in 2023NEI | Other Combustion; Western Forest Prescribed Burning; Smoldering + Flaming |
| 2810084002 | New in 2023NEI | Other Combustion; Western Forest Prescribed Burning; CWD Residual Smoldering |
| 2810084003 | New in 2023NEI | Other Combustion; Western Forest Prescribed Burning; Duff Residual Smoldering |
| 2811016000 | New in 2023NEI | Other Combustion; Prescribed Forest Burning - Pile Burns; Total (Smoldering + Flaming) |
Agricultural burning refers to fires that occur over land used for cultivating crops and agriculture. Another term for this sector is crop residue burning. In past NEIs for this sector, it was exclusively limited to emissions resulting in the burning of crops. However, in the 2014 NEI, we included pasture/grass burning SCCs into this sector. However, for technical reasons, we have moved the grass/pasture burning to the wildland fires category for the 2017, 2020 and 2023 NEIs, thereby causing this sector to once again only house emissions resulting from burning of crops.
Table 13.4 shows the agricultural field burning SCCs covered by the EPA estimates and by the State/Local and Tribal agencies that submitted data. The leading SCC description is “Miscellaneous Area Sources; Agriculture Production - Crops - as nonpoint; Agricultural Field Burning - whole field set on fire;” for all SCCs in the table. Note that many general crops are included in the SCC 2801500000, and it also is the SCC to report into for “crops unknown.” A new SCC was added 2801540000 to support the new method used to estimate emissions from ditch burns on agricultural lands. Previously, these ditch burns were in the prescribed burn sector in the 2020NEI. The assumed area of the ditch burns was reduced to 5 acres per satellite detection based on analysis of active ditch fires.
| SCC | EPA default | SLT submitted | Agricultural burn SCC description |
|---|---|---|---|
| 2801500000 | X | X | Unspecified crop type and Burn Method |
| 2801500112 | X | Field Crop is Alfalfa: Backfire Burning | |
| 2801500130 | X | Field Crop is Barley | |
| 2801500141 | X | X | Field Crop is Bean (red): Headfire Burning |
| 2801500142 | X | Field Crop is Bean (red): Backfire Burning | |
| 2801500150 | X | X | Field Crop is Corn |
| 2801500151 | X | X | Double Crop Winter Wheat and Corn |
| 2801500152 | X | Double Crop Corn and Soybeans | |
| 2801500160 | X | X | Field Crop is Cotton |
| 2801500171 | X | X | Fallow |
| 2801500182 | X | Field Crop is Hay (wild) | |
| 2801500220 | X | X | Field Crop is Rice |
| 2801500250 | X | X | Field Crop is Sugar Cane |
| 2801500262 | X | X | Field Crop is Wheat: Backfire Burning |
| 2801500263 | X | X | Double Crop Winter Wheat and Cotton |
| 2801500264 | X | X | Double Crop Winter Wheat and Soybeans |
| 2801500600 | X | Forest Residues Unspecified | |
| 2801540000 | X | X | Ditch Burning (new SCC) |
| 2801600300 | X | Pile Burning; Orchard Crop Other | |
| 2801600320 | X | Pile Burning; Orchard Crop is Apple | |
| 2801600350 | X | Pile Burning; Orchard Crop is Cherry | |
| 2801600410 | X | Pile Burning; Orchard Crop is Peach | |
| 2801600420 | X | Pile Burning; Orchard Crop is Pear | |
| 2801600430 | X | Pile Burning; Orchard Crop is Prune | |
| 2801600500 | X | Pile Burning; Vine Crop | |
| 2811020002 | X | Rangeland Burning |
13.5.2 Wildland Fires Emissions Estimation Methodology
The national and S/L/T activity data mentioned earlier were used to estimate daily wildfire and prescribed burn emissions from flaming combustion and smoldering combustion phases for the 2023 NEI inventory. Flaming combustion is more complete combustion than smoldering and is more prevalent with fuels that have a high surface-to-volume ratio, a low bulk density, and low moisture content. Smoldering combustion occurs without a flame, is a less complete burn, and produces some pollutants, such as PM2.5, VOCs, and CO, at higher rates than flaming combustion. Smoldering combustion is more prevalent with fuels that have low surface-to-volume ratios, high bulk density, and high moisture content.
Figure 13.3 is a schematic of data processing stream for the 2023 NEI inventory for wildfire and prescribe burn sources. The EPA’s 2023 NEI wildland fire emissions estimates were estimated using a modified Satellite Mapping Automated Reanalysis Tool for Fire Incident Reconciliation version 2 (Smartfire2) and US Forest Service’s BlueSky Pipeline (BSP) system. Smartfire2 is an algorithm and database system that operates within a geographic information system (GIS). Smartfire2 combines multiple sources of fire information and reconciles them into a unified GIS database. It reconciles fire data from space-borne sensors and ground-based reports, thus drawing on the strengths of both data types while avoiding double-counting of fire events. At its core, Smartfire2 is an association engine that links reports covering the same fire in any number of multiple databases. In this process, all input information is preserved, and no attempt is made to reconcile conflicting or potentially contradictory information (for example, the existence of a fire in one database but not another). Further details of the Smartfire2 process as applied to NEI development can be found in the literature [ref 1].
For the 2023 NEI inventory, the national and S/L/T fire information was input into Smartfire2 and then merged and reconciled together based on user-defined weights for each fire information dataset. The relative weights used for the national data stream are shown in Table 13.5. A dataset type with a higher ranking gets preference for that attribute in the reconciled activity. The uncertainty of each dataset is used to generate date and spatial buffers when reconciling fire activity (13.6). The output from Smartfire2 was daily acres burned by fire type, and latitude-longitude coordinates for each fire. The fire type assignments were made using the fire information datasets. If the only information for a fire was a satellite detect for fire activity, then the fire was assumed to be a prescribed burn with the only exceptions being the following month-state assumptions where the fire was then assumed to be a wildfire:
Arizona, California, Nevada, and New Mexico: June through August
Oregon, Washington, Idaho, Montana, Colorado, Utah and Wyoming: July through September
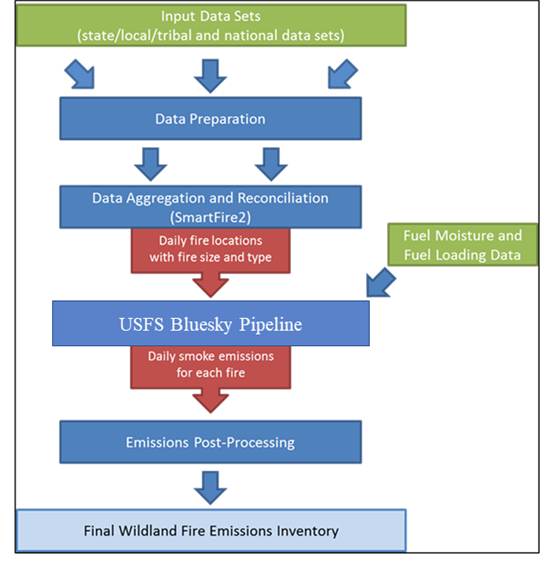
Figure 13.3: Processing flow for fire emission estimates in the 2023 NEI inventory. Input, Data Prep, Data aggregation and reconciliation, USFS Bluesky Pipeline, Emissions Post-Processing, final Inventory
| Dataset Name | Location Weight | Size Weight | Shape Weight | Growth Weight | Name Weight | Type Weight |
|---|---|---|---|---|---|---|
| HMS | 0.9 | 0.2 | 0.4 | 0.9 | 0.2 | 0.2 |
| FACTS | 0.4 | 0.3 | 0.5 | 0.6 | 0.7 | 0.6 |
| CalMapper | 0.6 | 0.7 | 0.7 | 0.4 | 0.8 | 0.8 |
| WFIGS | 0.7 | 0.9 | 0.8 | 0.3 | 0.9 | 0.9 |
| PFIRS | 0.3 | 0.4 | 0.3 | 0.2 | 0.3 | 0.4 |
| ICS-209 | 0.2 | 0.5 | 0.2 | 0.5 | 0.5 | 0.3 |
| InFORM | 0.2 | 0.5 | 0.2 | 0.5 | 0.5 | 0.3 |
| NFPORS | 0.5 | 0.6 | 0.6 | 0.7 | 0.6 | 0.7 |
| CalFIRE | 0.65 | 0.75 | 0.75 | 0.4 | 0.75 | 0.85 |
| FL/GA/SC/NC | 0.9 | 0.95 | 0.1 | 0.8 | 0.95 | 0.95 |
| other state data | 0.8 | 0.8 | 0.1 | 0.8 | 0.4 | 0.95 |
| Dataset Name | Detection Rate | False Alarm Rate | Start Date Uncertainty | End Date Uncertainty | Location Uncertainty |
|---|---|---|---|---|---|
| HMS | 0.6 | 0.3 | 6 | 5 | 1 |
| FACTS | 0.5 | 0.4 | 3 | 1 | 0.2 |
| CalMapper | 0.5 | 0.5 | 3 | 1 | 0.1 |
| WFIGS | 0.6 | 0.1 | 3 | 6 | 0.2 |
| PFIRS | 0.5 | 0.5 | 3 | 2 | 0.5 |
| ICS-209 | 0.5 | 0.5 | 3 | 5 | 2 |
| InFORM | 0.5 | 0.5 | 3 | 5 | 2 |
| NFPORS | 0.6 | 0.2 | 3 | 1 | 0.1 |
| CalFIRE | 0.7 | 0.1 | 3 | 5 | 0.1 |
| FL/GA/SC/NC | 0.8 | 0.1 | 1 | 1 | 0.1 |
| other state data | 0.8 | 0.1 | 4 | 4 | 4 |
States that submitted complete activity datasets were not processed through SmartFire2 with the default national activity. An exception is for those states that used HMS fire detections for daily apportionment of activity data. All resulting activity that was identified only through HMS was removed from the final activity dataset so that only state-submitted event values were used for emissions estimates. State-submitted activity from Georgia and North Carolina were not processed through SmartFire2. Instead, each activity dataset was converted into daily activity files in a format that can be read directly by Bluesky Pipeline.
The BlueSky Pipeline (BSP version 4.2.13) was used to calculate fuel loading and consumption, and emissions using various models depending on the available inputs as well as the desired results. BSP is open source at https://github.com/pnwairfire/bluesky. The conterminous United States, Alaska, and Hawaii, where Fuel Characteristic Classification System (FCCS) fuel loading data are available, were processed using the modeling chain described in Figure 13.4. The Smoke Emissions Reference Application (SERA) emissions factors for CAPs are included in the BSP version used in the 2023 NEI. SERA is a searchable online database coordinated by the US Forest Service and University of Washington (https://depts.washington.edu/nwfire/sera/index.php) that consists of existing peer-reviewed emission factors (EFs) of 276 known air pollutants. The SERA database enables the analysis and summaries of existing emissions factors, and creation of average emissions factors to be used in decision support tools for smoke management, including BSP. Fire Emissions Production Simulator (FEPS) emissions factors were used in previous NEIs. The HAP emission factors used in this work came from Urbanski, 2014 [ref 3]. These emission factors were regionalized and handled differently by wild and prescribed fire. Table 13.7 below outlines the regionalization scheme used while Table 13.8 shows the HAP EFs employed in this work for wildland fires.
| Region | Wildfires | Prescribed burning |
|---|---|---|
| Region 1 | AZ, CA, IA, IL, IN, KS, MO, NM, NV, OH, OK, TX | AZ, CA, IA, IL, IN, KS, MO, NM, NV, OH, OK, TX |
| Region 2 | AK, AL, AR, CT, DC, DE, FL, GA, HI, KY, LA, MA, MD, ME, MI, MN, MS, NC, NH, NJ, NY, PA, PR, RI, SC, TN, VA, VI, VT, WI, WV | AL, AR, CT, DC, DE, FL, GA, HI, KY, LA, MA, MD, ME, MI, MN, MS, NC, NH, NJ, NY, PA, PR, RI, SC, TN, VA, VI, VT, WV |
| Region 3 | CO, ID, MT, ND, NE, OR, SD, UT, WA, WY | AK, CO, ID, MT, ND, NE, OR, SD, UT, WA, WI, WY |
| HAP | Pollutant ID | Flaming Region 1 | Flaming Region 2 | Flaming Region 3 | Smoldering Region 1 | Smoldering Region 2 | Smoldering Region 3 |
|---|---|---|---|---|---|---|---|
| 1,3-Butadiene | 106990 | 0.2723268 | 0.5166199 | 0.3624349 | 0.2723268 | 0.5166199 | 0.3624349 |
| Acetaldehyde | 75070 | 1.6780136 | 1.2835402 | 2.2406888 | 1.6780136 | 1.2835402 | 2.2406888 |
| Acetonitrile | 75058 | 0.3223869 | 0.0640769 | 0.4305166 | 0.3223869 | 0.0640769 | 0.4305166 |
| Acrolein | 107028 | 0.5126151 | 0.6467761 | 0.6848218 | 0.5126151 | 0.6467761 | 0.6848218 |
| Acrylic Acid | 79107 | 0.0700841 | 0.0580697 | 0.0941129 | 0.0700841 | 0.0580697 | 0.0941129 |
| Anthracene | 120127 | 0.0050000 | 0.0050000 | 0.0050000 | 0.0050000 | 0.0050000 | 0.0050000 |
| Benz(a)anthracene | 56553 | 0.0062000 | 0.0062000 | 0.0062000 | 0.0062000 | 0.0062000 | 0.0062000 |
| Benzene | 71432 | 0.4505406 | 0.5666800 | 0.6007209 | 0.4505406 | 0.5666800 | 0.6007209 |
| Benzo(a)fluoranthene | 203338 | 0.0026000 | 0.0026000 | 0.0026000 | 0.0026000 | 0.0026000 | 0.0026000 |
| Benzo(a)pyrene | 50328 | 0.0014800 | 0.0014800 | 0.0014800 | 0.0014800 | 0.0014800 | 0.0014800 |
| Benzo(c)phenanthrene | 195197 | 0.0039000 | 0.0039000 | 0.0039000 | 0.0039000 | 0.0039000 | 0.0039000 |
| Benzo(e)pyrene | 192972 | 0.0026600 | 0.0026600 | 0.0026600 | 0.0026600 | 0.0026600 | 0.0026600 |
| Benzo(ghi)perylene | 191242 | 0.0050800 | 0.0050800 | 0.0050800 | 0.0050800 | 0.0050800 | 0.0050800 |
| Benzo(k)fluoranthene | 207089 | 0.0026000 | 0.0026000 | 0.0026000 | 0.0026000 | 0.0026000 | 0.0026000 |
| Benzofluoranthenes | 56832736 | 0.0051400 | 0.0051400 | 0.0051400 | 0.0051400 | 0.0051400 | 0.0051400 |
| Carbonyl Sulfide | 463581 | 0.0005340 | 0.0005340 | 0.0005340 | 0.0005340 | 0.0005340 | 0.0005340 |
| Chrysene | 218019 | 0.0062000 | 0.0062000 | 0.0062000 | 0.0062000 | 0.0062000 | 0.0062000 |
| Fluoranthene | 206440 | 0.0067300 | 0.0067300 | 0.0067300 | 0.0067300 | 0.0067300 | 0.0067300 |
| Formaldehyde | 50000 | 2.5150180 | 3.3660392 | 4.4753704 | 2.5150180 | 3.3660392 | 4.4753704 |
| Indeno(1,2,3-cd)pyrene | 193395 | 0.0034100 | 0.0034100 | 0.0034100 | 0.0034100 | 0.0034100 | 0.0034100 |
| m,p-Xylenes | 1330207 | 0.2162595 | 0.1601922 | 0.2883460 | 0.2162595 | 0.1601922 | 0.2883460 |
| Methanol | 67561 | 2.3067681 | 1.9743692 | 5.0360433 | 2.3067681 | 1.9743692 | 5.0360433 |
| Methyl Chloride | 74873 | 0.1283250 | 0.1283250 | 0.1283250 | 0.1283250 | 0.1283250 | 0.1283250 |
| Methylanthracene | 26914181 | 0.0082300 | 0.0082300 | 0.0082300 | 0.0082300 | 0.0082300 | 0.0082300 |
| Methylbenzopyrenes | 65357699 | 0.0029600 | 0.0029600 | 0.0029600 | 0.0029600 | 0.0029600 | 0.0029600 |
| Methylchrysene | 41637905 | 0.0079000 | 0.0079000 | 0.0079000 | 0.0079000 | 0.0079000 | 0.0079000 |
| Methylpyrene, fluoranthene | 2381217 | 0.0090500 | 0.0090500 | 0.0090500 | 0.0090500 | 0.0090500 | 0.0090500 |
| n-Hexane | 110543 | 0.0480577 | 0.0240288 | 0.0640769 | 0.0480577 | 0.0240288 | 0.0640769 |
| Naphthalene | 91203 | 0.4865839 | 0.3984782 | 0.6507809 | 0.4865839 | 0.3984782 | 0.6507809 |
| o-Xylene | 95476 | 0.0760913 | 0.0500601 | 0.1001201 | 0.0760913 | 0.0500601 | 0.1001201 |
| Perylene | 198550 | 0.0008560 | 0.0008560 | 0.0008560 | 0.0008560 | 0.0008560 | 0.0008560 |
| Phenanthrene | 85018 | 0.0050000 | 0.0050000 | 0.0050000 | 0.0050000 | 0.0050000 | 0.0050000 |
| Pyrene | 129000 | 0.0092900 | 0.0092900 | 0.0092900 | 0.0092900 | 0.0092900 | 0.0092900 |
| Styrene | 100425 | 0.1041249 | 0.0800961 | 0.1381658 | 0.1041249 | 0.0800961 | 0.1381658 |
| Toluene | 108883 | 0.3444133 | 0.3984782 | 0.4585503 | 0.3444133 | 0.3984782 | 0.4585503 |
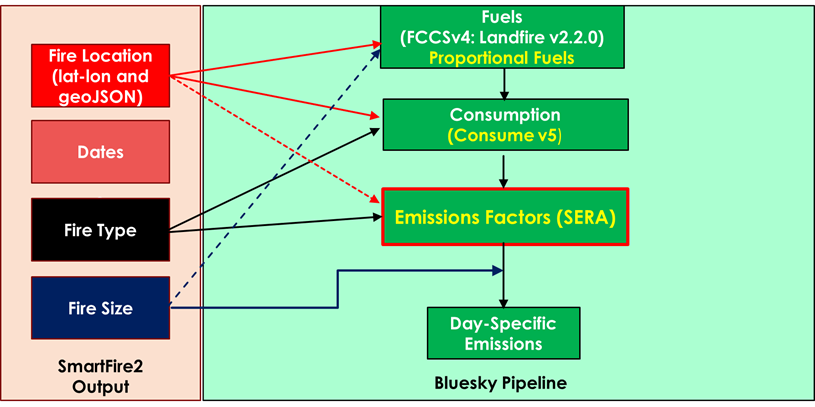
Figure 13.4: BlueSky Pipeline Modules
For the 2023 NEI inventory, the FCCSv4 spatial vegetation cover was upgraded to the LANDFIRE v2.2.0 fuel vegetation cover. The FCCSv4 fuel bed characteristics were implemented along with LANDFIREv2.2.0 to provide better fuel classification for the BlueSky Pipeline. The LANDFIREv2.2.0 raster data were aggregated from the native resolution and projection to 120-meter resolution using a nearest-neighbor methodology. Aggregation and reprojection was required to allow these data to work in the BlueSky Pipeline.
Outputs from each BlueSky Pipeline processing stream were aggregated into an annual file. Fires identified as being over water by FCCS were removed because they produce no fuel consumption in the CONSUME model and thus no emissions.
In August 2023, a wildfire occurred in Maui County that spread to the nearby city of Lahaina. This fire was a Wildland Urban Interface (WUI) fire where a fire spread across both an urban area and undeveloped land. Thousands of structures and vehicles were burned in Lahaina. The current wildland emissions methodology for the NEI does not include a method for estimating emissions from WUIs. However, for the 2023 NEI the emissions for the wildland part of this WUI fire was estimated in BSP. This consisted of about 2000 acres of shrubland. The emissions from the structures and vehicles burned were estimated for the NEI but are explained in the new Structures and Motor Vehicle Fies section of the 2023 NEI TSD.
13.5.3 Pile burn methodology
For the 2023 NEI, pile burn (PB) emissions were estimated using a combination of federal, state, local, and tribal activity data. This activity data was supplied in the form of daily estimates of area treated, pile volume, pile dimensions, or mass piled by location, varying by data source. As with the prescribed burn and wildfire S/L/T activity data, the pile burn data was imported into Smartfire2 so that it could be reconciled with other data sources to avoid duplication of activity and emissions. HMS satellite detects that reconciled only with the location of the PB activity were removed from the BSP workflow as pile burns. The PB activity data was then directly imported into a calculator script outside of BSP that estimates the amount of biomass consumed at each location and the resulting emissions. The consumption calculations made are consistent with those used in the University of Washington pile burn calculator (https://depts.washington.edu/nwfire/piles/). For activity data where only, a treated area is provided a default fuel loading of 4.5 tons per acre is used based on an analysis of California and Washington historical pile burn permits. A consumption efficiency of 90% is assumed unless otherwise specified in the activity data. Emissions factors averaged over pile burn studies in the SERA database [ref 2] were applied to estimate CAPs from the consumed piled biomass.
13.5.4 Flint Hills prescribed burns methodology
For the 2023 NEI, the emissions from the Flint Hills prescribed burns continued to be calculated outside of BSP. The emissions were calculated for the period of February 3 through May 1, 2023, for the Kansas and Oklahoma counties that make up the Flint Hills region. All “Grass” HMS detects in these counties for this period were used to calculate per county acres per HMS detect. The range for these Flint Hills counties was ~ 50 -160 acres per detect. SERA grass emission factors were used to estimate emissions for all pollutants except PM2.5, which were derived from a field study of Flint Hills prescribed fires [ref 9]. Wildfires did occur during this period in the Flint Hills. Osage County, Oklahoma had about 85,000 acres burned due to wildfires during this time. These wildfires were inserted back into the BSP processing and emissions estimated using the BSP.
13.5.5 Agricultural Field Burning Emissions Methodology
The approach developed for use previous NEIs [ref 6], and was generally used again for the 2023 NEI with some modifications:
Multiple satellite detections are used to locate fires using an operational product
Field Size estimates are based on field work studies in multiple states (rather than a one size fits all approach)
This method allows for intra-annual as well as annual changes in crop land use
This method uses 2023 USDA NASS Crop Sequence Boundaries (CSB) shapefiles (https://www.nass.usda.gov/Research_and_Science/Crop-Sequence-Boundaries/index.php) to separate grass/pasture lands, which include Pasture/Grass, Grassland Herbaceous, and Pasture/Hay lands from all other agricultural burning and to identify the crop type. The 2020NEI used Cropland Data Layer (CDL) (USDA, 2015a) information instead of CSB shapefiles.
In the 2020NEI, removal of agricultural fires from the Hazard Mapping System (HMS) dataset was done before the application of the Smartfire2 system for wildfires and prescribed fires in an attempt to eliminate double counting in the NEI and the use of state information to further identify fires as crop residue burning rather than another type of fire. However, this did not eliminate all double counting cases. In the 2023 NEI, HMS detects and SLT agricultural burn activity were allowed as input into Smartfire2. The CSB shapefiles were used post-Smartfire2 to determine which satellite-only detected fires were to be assigned as agricultural burns.
EPA designed a new crop burning module for use in BSP for the 2023 NEI. This BSP module calculated consumption and emissions for all agricultural burns except ditch burns which were calculated outside of BSP.
Based on field reconnaissance of McCarty (2013) [ref 8], a “typical” field size was assumed for each burn location, which varied by region of the country. The assumed field sizes by state are shown in Table 13.9. For the S/L/T agencies that submitted agricultural field burning activity that include acres burned those data were used instead of the data shown in Table 13.9.
| States | Average Field Size (Acres) |
|---|---|
| FL, IL, IN, IA, MN, MO, NE, ND, SD | 60 |
| AZ, CO, KS, NM, OK, TX, WY | 80 |
| CA, ID, MT, OR, WA | 120 |
| All other states | 40 |
Emission Factors for agricultural burns for CO, NOx, SO2, PM2.5 and PM10 were based on Table 1 from McCarty (2011) [ref 5]. The emission factors in McCarty (2011) were based on mean values from all available literature at the time. Emission Factors for NH3 were derived from the 2002 NEI crop residue emission estimates using the ratio of NH3/NOx and the NOx emission factor in Table 1 from McCarty (2011). The emissions factors used in the 2023 NEI are shown below in Table 13.10.
A subset of the HAP emission factors is shown in Table 13.11. These are based on updated VOC work mentioned above. The full set of HAP emission factors, available on the [2020 NEI Supplemental data FTP site], also includes the following HAPs: isopropylbenzene, n-hexane, o-xylene, propionaldehyde, styrene, toluene, 2,2,4-trimethylpentane, and m, p-xylenes. The sugarcane emissions factors were updated for the 2020NEI and used again in 2023 NEI.
| Crop Type | Emission Factor |
|---|---|
| Corn | 18.47 |
| Wheat | 18.69 |
| Soybean | 18.47 |
| Cotton | 18.47 |
| Fallow | 18.47 |
| Rice | 18.26 |
| Sugarcane | 14.70 |
| All Other crops/Default | 18.47 |
| Double Crop Wheat/Soybeans | 18.58 |
| Double Crop Corn/Soybeans | 18.47 |
| Double Crop Wheat/Cotton Sorghum | 18.58 |
| Crop Type | SCC | Acetaldehyde | Benzene | 1,3-butadiene | Ethylbenzene | Formaldehyde |
|---|---|---|---|---|---|---|
| Other | 2801500000 | 1.521677 | 0.227658 | 0.161739 | 0.026645 | 1.025634 |
| Red Bean | 2801500141 | 1.521677 | 0.227658 | 0.161739 | 0.026645 | 1.025634 |
| Red Bean | 2801500142 | 1.521677 | 0.227658 | 0.161739 | 0.026645 | 1.025634 |
| Corn | 2801500150 | 1.521677 | 0.227658 | 0.161739 | 0.026645 | 1.025634 |
| Wheat and Corn | 2801500151 | 1.311003 | 0.224041 | 0.144669 | 0.020768 | 1.190770 |
| Corn and Soybeans | 2801500152 | 1.521677 | 0.227658 | 0.161739 | 0.026645 | 1.025634 |
| Cotton | 2801500160 | 1.521677 | 0.227658 | 0.161739 | 0.026645 | 1.025634 |
| Fallow | 2801500171 | 1.521677 | 0.227658 | 0.161739 | 0.026645 | 1.025634 |
| Rice | 2801500220 | 1.943024 | 0.234892 | 0.195879 | 0.038401 | 0.695364 |
| Sugarcane | 2801500250 | 0.238933 | 0.580000 | 0.000000 | 0.920000 | 0.800000 |
| Wheat | 2801500262 | 1.100330 | 0.220424 | 0.127599 | 0.014890 | 1.355905 |
| Wheat and Cotton | 2801500263 | 1.311003 | 0.224041 | 0.144669 | 0.020768 | 1.190770 |
| Wheat and Soybeans | 2801500264 | 1.311003 | 0.224041 | 0.144669 | 0.020768 | 1.190770 |
13.5.6 SLT direct emissions submittals -agricultural field burning
S/L/Ts were encouraged only to supply activity for wildland fires for 2023 NEI but could submit agricultural burn emissions. The agencies listed in Table 13.12 submitted PM2.5 emissions for this sector; agencies not listed used EPA estimates for the entire sector. As we will discuss below, some agencies provided agricultural field burning activity that was used in estimating emissions using EPA’s methodology. Some agencies submitted emissions for the entire sector while others submitted only a portion of this sector. When an agency submits less than 100%, their Nonpoint Survey responses, along with other general business rules for building the NEI, are used to backfill with EPA estimates as appropriate.
| Region | Agency | S/L/T |
|---|---|---|
| 2 | New Jersey Department of Environment Protection | State |
| 9 | Maricopa County, Arizona | County |
| 10 | Idaho Department of Environmental Quality | State |
| 10 | Nez Perce Tribe | Tribe |
| 10 | Washington State Department of Ecology | State |
13.5.7 PM speciation for all fires
The S/L/Ts were not permitted to submit PM2.5 speciated emissions, which are required in the NEI. These PM species pollutants include EC, OC, SO4, NO3, and “other” (PMFINE). These were estimated for all nonpoint data -including those states that submitted direct emissions by EPA using the fractions from SPECIATE v5.0 [ref 4] shown in 13.13.
| Species | Fraction |
|---|---|
| PEC | 0.0323 |
| POC | 0.4688 |
| PNO3 | 0.0003 |
| PSO4 | 0.0013 |
| PMFINE | 0.4973 |
13.5.8 Quality Assurance (QA) of Final Results
Different types of QA were generally applied for wildland fires. The summary below briefly describes the QA checks used in these processes:
Reviewed input data sets to identify data gaps.
Identified fire incidents that appeared to be double counted in individual data sets and removed duplicate records.
Examined fires with long durations or conflicts between date fields such as start date and report date to identify fires that may have erroneous dates and made necessary corrections.
Reviewed fire locations to ensure that they fell within the United States. Obvious errors in data entry such as the reversal of latitude and longitude were corrected where possible.
Reviewed large wildfires in each data set for validity.
Modified distant fires (in different states) with the same names to ensure that the events were not associated.
Quality assurance actions applied to daily fire locations from SmartFire2 included:
Checked the location, fire type, duration, underlying fire activity input data, final shape, and final size for large fire events (i.e., area burned >10,000 acres) to ensure that the results were reasonable.
Checked large fire events by state and by name, removed duplicate events, and renamed fires as needed.
Reviewed large fire events with multiple data sources to ensure that SmartFire2 reconciliation rankings were correct and produced sensible results.
Identified and removed fire event duplicates incorrectly created by the SmartFire2 reconciliation process.
Checked fire events with large differences between the calculated fire area and the geometric fire area. Since the shape and area are calculated separately in SmartFire2, a large discrepancy can indicate errors in reconciliation.
Quality assurance actions applied to resulting emissions estimates included:
Checked the location of all final fires and emission estimates. Fires falling outside of the United States were removed. Some fires near the border were retained if fuel information was available in that location.
Identified fire records that were incorrectly associated and adjusted fire event size and emissions proportionally.
Produced and reviewed summary tables and plots of the 2023 fire inventory data.
Compared wildfire acres burned by state and individual major wildfires to National Interagency Fire Center (NIFC) data to ensure the summary values were within reasonable range.
WLF emissions developed using the methods described above were compared to previous years estimates including the 2020NEI and the recent year 2022 inventory generated by EPA, SLTs, MJOs and other federal agencies. The spatial (and temporal) patterns seen in the data correspond to what was expected in 2023. In general, 2023 was a very quiet fire year than many previous years, so the emissions are expected to be lower nationally.
All revisions due to the quality assurance steps were processed through the Emissions Inventory System (EIS) and summary files were posted on the EPA ftp site https://gaftp.epa.gov/Air/nei/2023/doc/supporting_data/events/v1/ on September 4, 2025.
13.5.9 Quality Assurance of Agricultural field burning
Review of the quality of EPA’s data included addressing of S/L/T comments as we received them during the 2023 NEI process. In addition, the following checks were done on EPA data:
Comparison to past NEI estimates, and explaining differences noted
Check of diurnal profile using day specific data generated by EPA methods with existing profiles used for air quality modeling
Using past comments received from S/L/Ts for this sector to ground truth estimates
Ensuring HAPs and VOC speciation line up as expected
The QA of S/L/T-submitted data included checking with EPA estimates, working with S/L/Ts to understand why differences exist, and making sure pollutant coverage is complete.