13.6 Emissions Summaries
13.6.1 Wildland Fires
This section shows several graphics and tables that describe emissions of wild and prescribed fires in the 2023 NEI based on the methods discussed above. Table 13.14 provides national totals of acres burned and CAPs emissions for wildfires, prescribed burns and pile burns. Pile burns are part of the prescribed burn category but are show separately here since it is a new method for the 2023 NEI.
| Pollutant | 2023NEI Wildfires | 2023NEI Prescribed burns (no pile burns) | 2023NEI Pile burns | Total Wildland |
|---|---|---|---|---|
| ACRES BURNED | 2,911,888 | 13,181,343 | 16,093,231 | |
| PM2.5 (tons) | 884,537 | 1,126,551 | 29,123 | 2,040,211 |
| VOC (tons) | 2,371,088 | 1,810,376 | 3,433 | 4,184,897 |
| NOX (tons) | 68,017 | 121,462 | 7,690 | 197,169 |
| CO (tons) | 6,789,077 | 7,804,179 | 224,516 | 14,817,773 |
| SO2 (tons) | 49,961 | 78,207 | 381 | 128,549 |
| NH3 (tons) | 65,260 | 68,369 | 1,532 | 135,161 |
Table 13.15 provides national totals for burned acres and CAPs for each forest/ecoregion and fire type. The newly added SCCs allow for further analyses like this table. As mentioned earlier in the year 2023 was a very quiet wildfire season. It is unusual for the prescribed burns PM2.5 emissions to be higher than wildfire emissions but this case can occur during very quiet wildfire seasons. Most of the Boreal Forest emissions occurred in Alaska. Note grassland acres burned make up a good portion of the acres burned for the US but grasses have a lower PM2.5 emissions factor. Figure 13.5 provides an illustration of just the PM2.5 emissions nationally and by forest/ecoregion for year 2023.
| SCC Ecoregion | Acres | PM2.5 | VOC | CO | NOx | SO2 | NH3 |
|---|---|---|---|---|---|---|---|
| Eastem Forest Prescribed Burning | 5,492,380 | 600,639 | 764,156 | 4,024,217 | 74,348 | 36,862 | 25,461 |
| Western Forest Wildfires | 960,708 | 366,068 | 862,274 | 2,713,692 | 25,629 | 26,709 | 27,555 |
| Boreal Forest Wildfires | 295,253 | 335,318 | 1,202,892 | 2,812,756 | 22,159 | 10,736 | 26,215 |
| Grassland Prescribed Burning | 4,785,192 | 290,207 | 536,545 | 2,114,821 | 23,004 | 26,356 | 26,468 |
| Western Forest Prescribed Burning | 1,518,351 | 162,316 | 316,485 | 1,152,784 | 13,733 | 10,910 | 10,549 |
| Eastern Forest Wildfires | 530,066 | 114,006 | 151,673 | 766,339 | 14,253 | 7,181 | 4,922 |
| Grassland Wildfires | 757,901 | 45,053 | 82,867 | 321,715 | 3,544 | 3,850 | 3,943 |
| Boreal Forest Prescribed Burning | 105,746 | 39,394 | 128,338 | 318,077 | 2,703 | 1,210 | 3,037 |
| Shrubland Wildfires | 367,960 | 24,093 | 71,382 | 174,576 | 2,432 | 1,485 | 2,624 |
| Flint Hills Prescribed Burning | 1,114,770 | 22,828 | 38,932 | 115,655 | 6,355 | 2,268 | 1,638 |
| Shrubland Prescribed Burning | 164,903 | 11,168 | 25,920 | 78,625 | 1,319 | 601 | 1,216 |
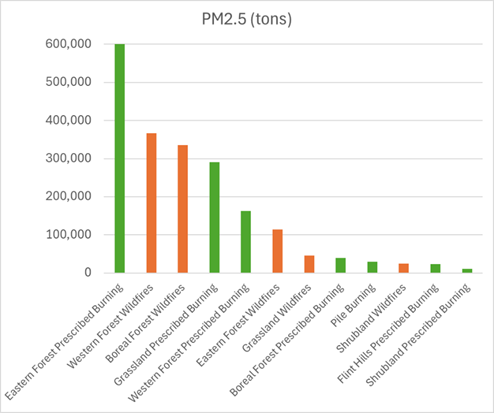
Figure 13.5: 2023 NEI PM2.5 emissions by forest/ecoregion and fire type category
Figures 13.6 and 13.7 show acres burned and PM2.5 emissions for all fires by month in 2023. The total emissions that result from month-to-month result from a combination of different fuels that burn in different fires. It is seen that wildfires (WF) are more prevalent in the hotter months, and prescribed fires (RX) occur more often in the cooler months of 2023. Flint Hills prescribed burns are show separately to mark when those occurred over eastern Kansas and Oklahoma. Pile burns (PB) emissions are also shown but are very minor in most months.
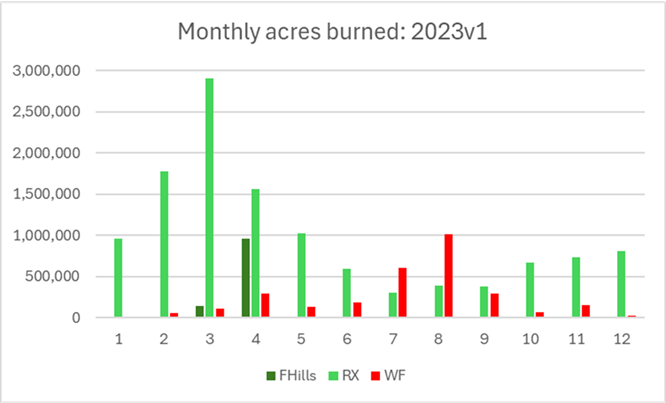
Figure 13.6: Monthly acres burned by fire type for 2023 NEI CONUS Wildland Fires
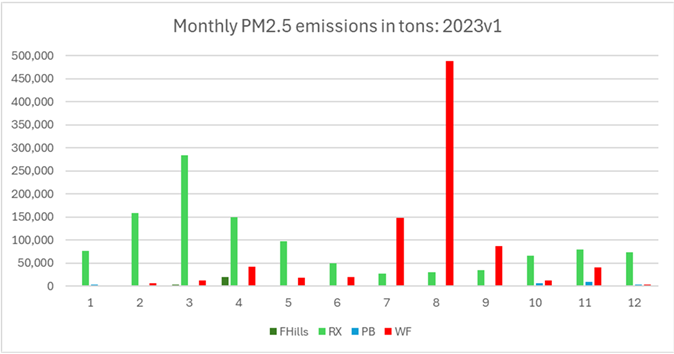
Figure 13.7: Monthly PM2.5 by fire type for 2023 NEI CONUS Wildland Fires
Next, Table 13.16 shows a summary of acres burned and PM2.5 by state, fire type and combustion phase. In terms of total WLF acres burned, several states are shown to have more than one million acres burned in 2023, with FL, GA, KS and TX being the highest acres burned states. However, due to the nature of fuels burned and the type of fire that occurs in the various States, AK and OR are highest for estimated PM2.5 emissions.
| State | Prescribed burns acres burned | Prescribed burns PM2.5 (tons) | Wildfires acres burned | Wildfires PM2.5 (tons) | Total Wildland fire acres burned | Total Wildland fire PM2.5 (tons) |
|---|---|---|---|---|---|---|
| AL | 806,372 | 64,127 | 4,980 | 871 | 811,352 | 64,998 |
| AK | 17,223 | 14,615 | 296,751 | 336,654 | 313,974 | 351,269 |
| AZ | 237,971 | 17,056 | 214,436 | 14,455 | 452,407 | 31,511 |
| AR | 520,289 | 74,454 | 15,748 | 3,607 | 536,037 | 78,061 |
| CA | 150,734 | 25,702 | 376,952 | 116,250 | 527,686 | 141,953 |
| CO | 53,893 | 4,955 | 47,194 | 8,429 | 101,086 | 13,384 |
| CT | 1,118 | 158 | 321 | 80 | 1,438 | 238 |
| DE | 1,909 | 218 | 1,909 | 218 | ||
| DC | 8 | 3 | 8 | 3 | ||
| FL | 1,565,478 | 137,813 | 102,035 | 10,052 | 1,667,513 | 147,865 |
| GA | 1,241,104 | 96,029 | 17,236 | 2,382 | 1,258,339 | 98,411 |
| HI | 580 | 54 | 13,297 | 1,322 | 13,877 | 1,376 |
| ID | 72,627 | 12,009 | 104,523 | 25,278 | 177,150 | 37,287 |
| IL | 185,894 | 13,585 | 108 | 12 | 186,002 | 13,597 |
| IN | 65,815 | 6,899 | 597 | 102 | 66,411 | 7,001 |
| IA | 213,009 | 12,656 | 23,161 | 1,654 | 236,170 | 14,311 |
| KS | 1,481,127 | 43,261 | 6,035 | 260 | 1,487,162 | 43,521 |
| KY | 151,625 | 18,780 | 43,915 | 14,199 | 195,540 | 32,979 |
| LA | 698,543 | 73,607 | 172,194 | 18,922 | 870,737 | 92,530 |
| ME | 2,090 | 345 | 307 | 62 | 2,397 | 407 |
| MD | 24,920 | 2,367 | 1,460 | 207 | 26,380 | 2,574 |
| MA | 3,375 | 434 | 1,038 | 268 | 4,414 | 702 |
| MI | 24,926 | 2,454 | 4,071 | 924 | 28,997 | 3,378 |
| MN | 150,995 | 14,687 | 7,214 | 2,395 | 158,209 | 17,082 |
| MS | 413,569 | 32,426 | 27,694 | 2,888 | 441,263 | 35,313 |
| MO | 658,573 | 79,396 | 20,846 | 5,020 | 679,420 | 84,416 |
| MT | 86,362 | 9,919 | 112,404 | 29,025 | 198,765 | 38,944 |
| NE | 187,934 | 10,079 | 59,876 | 5,290 | 247,810 | 15,369 |
| NV | 12,625 | 256 | 4,844 | 72 | 17,469 | 328 |
| NH | 950 | 128 | 43 | 11 | 994 | 139 |
| NJ | 26,758 | 6,377 | 17,657 | 11,739 | 44,414 | 18,116 |
| NM | 172,902 | 9,808 | 200,081 | 20,181 | 372,984 | 29,988 |
| NY | 21,304 | 2,942 | 1,166 | 318 | 22,470 | 3,260 |
| NC | 189,832 | 17,901 | 90,035 | 17,994 | 279,867 | 35,895 |
| ND | 62,047 | 2,113 | 7,956 | 261 | 70,003 | 2,374 |
| OH | 49,263 | 5,029 | 770 | 185 | 50,034 | 5,214 |
| OK | 731,471 | 53,451 | 133,808 | 17,355 | 865,279 | 70,806 |
| OR | 53,051 | 24,004 | 224,305 | 129,372 | 277,356 | 153,376 |
| PA | 60,280 | 7,187 | 9,914 | 2,675 | 70,194 | 9,862 |
| RI | 663 | 101 | 465 | 99 | 1,128 | 200 |
| SC | 411,521 | 32,656 | 6,339 | 854 | 417,860 | 33,511 |
| SD | 65,773 | 3,073 | 1,662 | 33 | 67,435 | 3,106 |
| TN | 251,609 | 33,795 | 18,346 | 5,563 | 269,955 | 39,358 |
| TX | 1,647,666 | 109,636 | 223,948 | 14,414 | 1,871,614 | 124,050 |
| UT | 41,367 | 4,437 | 27,601 | 3,985 | 68,968 | 8,422 |
| VT | 1,950 | 246 | 12 | 4 | 1,963 | 250 |
| VA | 153,265 | 17,141 | 31,558 | 8,989 | 184,823 | 26,130 |
| WA | 10,964 | 680 | 167,917 | 32,574 | 178,881 | 33,254 |
| WV | 59,695 | 10,621 | 49,188 | 16,011 | 108,884 | 26,632 |
| WI | 87,971 | 11,919 | 4,352 | 769 | 92,324 | 12,689 |
| WY | 50,358 | 4,965 | 15,518 | 465 | 65,876 | 5,431 |
| National Total | 13,181,343 | 1,126,551 | 2,911,888 | 884,537 | 16,093,231 | 2,011,088 |
Figures 13.8 and 13.9 show 2023 county total area (acres) burned and PM2.5 emissions for wildfires, respectively. Even though 2023 was a quiet wildfire season the western portion of the country had the higher emitting counties. Figures 13.10 and 13.11 show 2023 county total area (acres) burned and PM2.5 emissions for prescribed burns, respectively. The Southeast states are seen to be dominated by prescribed fires. This is a typical pattern we see from NEI-to-NEI.
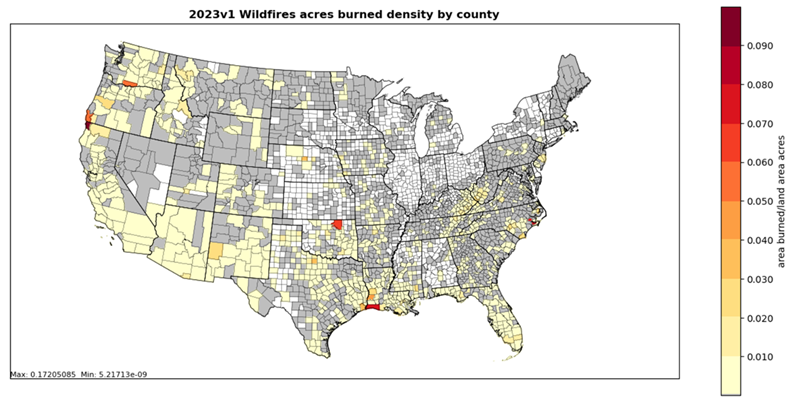
Figure 13.8: 2023 NEI wildland fires county area burned density map
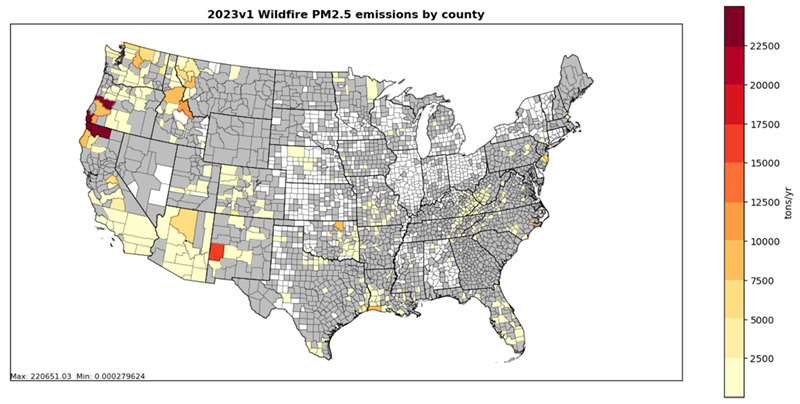
Figure 13.9: PM2.5 county emissions for wildfires for 2023 NEI
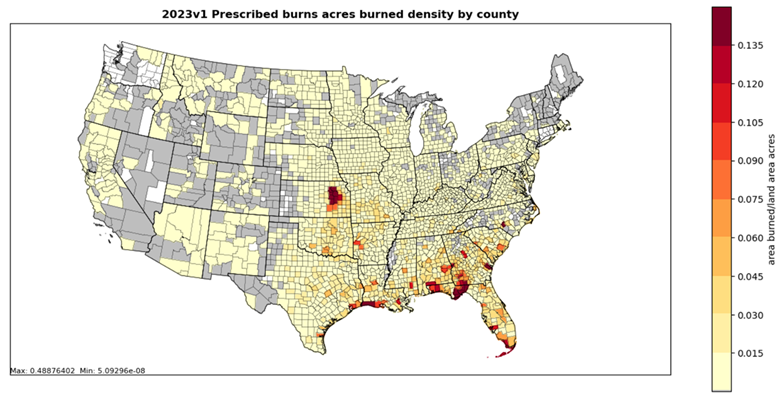
Figure 13.10: 2023 NEI prescribed burns acres burned density map
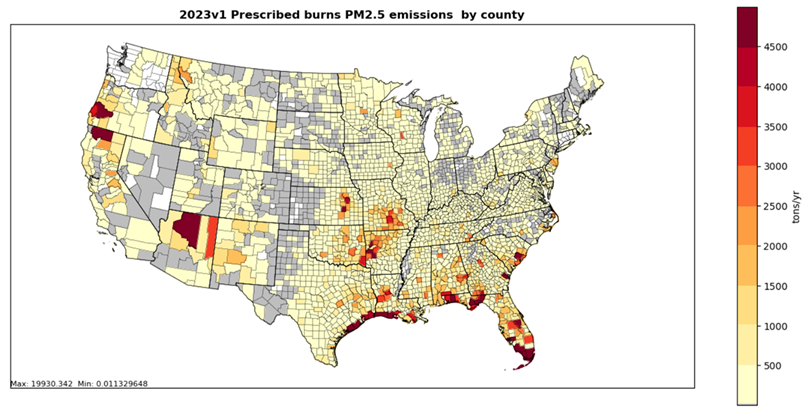
Figure 13.11: PM2.5 county emissions for prescribed burns for 2023 NEI
The amount of fire activity acquired by EPA for the NEI effort continues to increase with each NEI. When Smartfire2 doesn’t have any national or S/L/T activity to reconcile with it, it is then labeled as a satellite-only detected fire or HMS-only detected fire. Due to the location and months of these HMS-only detected fires they are assigned the prescribed burn fire type. If the HMS-only detect occurs on agricultural lands it is assigned an agricultural burn SCC. Table 13.17 provides a summary of the total acres and emissions from these HMS-only detected fires by fire type. Note that about 40% of the acres burned and emissions for prescribed burns (RX) are from HMS-only detected fires. In previous NEIs, this percentage approached or exceeded 50%. In future NEIs, if even more prescribed fire activity data is provided this percentage should continue to be reduced. The wildfire activity is much more complete thanks to national attention and detailed datasets. The HMS-only detects in summer months in western states are assumed to be wildfires and this only adds up to about 7% of the total wildfire acres burned and about 3% of the total emissions.
| Fire Type Description | Acres Burned | PM2.5 | VOC | CO | NOx | SO2 | NH3 |
|---|---|---|---|---|---|---|---|
| Total RX | 13,181,343 | 1,126,551 | 1,810,376 | 7,804,179 | 121,462 | 78,207 | 68,369 |
| HMS only RX | 5,582,767 | 463,476 | 742,355 | 3,204,575 | 46,615 | 33,167 | 29,847 |
| HMS % of Total RX | 42.4% | 41.1% | 41.0% | 41.1% | 38.4% | 42.4% | 43.7% |
| Total WF | 2,911,888 | 884,537 | 2,371,088 | 6,789,077 | 68,017 | 49,961 | 65,260 |
| HMS only WF | 219,343 | 22,591 | 53,190 | 155,985 | 1,981 | 1,478 | 1,753 |
| HMS % of Total WF | 7.5% | 2.6% | 2.2% | 2.3% | 2.9% | 3.0% | 2.7% |
Figure 13.12 provides a county map of the total HMS-only acres burned for prescribed burns in the 2023 NEI. The map shows that most of the HMS-only acres burned are in the southern central parts of the US. These are areas where there is a lack of prescribed burn activity available for use in the NEI. Table 13.18 provides state totals of HMS-only acres burned versus total acres burned for prescribed burns. There are numerous states in the southern central part of the country that have HMS-only acres burned about 80+% of their total acres burned by prescribed burns.
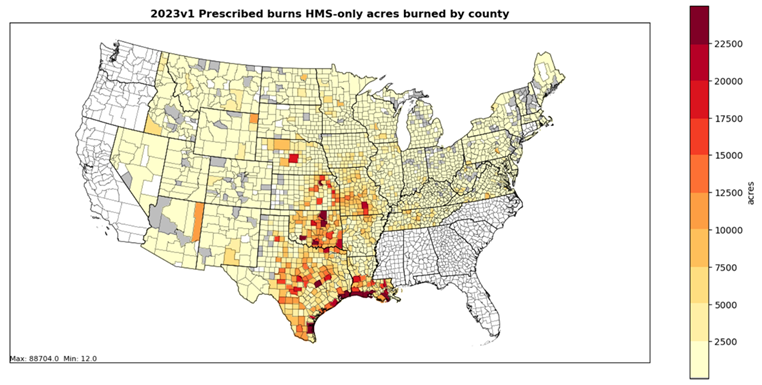
Figure 13.12: Satellite-only (HMS) detected county acres burned for prescribed burns
| State | HMS detect only acres | Total prescribed acres | % not reconciled with activity |
|---|---|---|---|
| Texas | 1,461,453 | 1,647,099 | 88.7% |
| Louisiana | 727,379 | 907,641 | 80.1% |
| Oklahoma | 671,152 | 759,581 | 88.4% |
| Missouri | 620,100 | 693,623 | 89.4% |
| Kansas | 415,477 | 1,488,957 | 27.9% |
| Arkansas | 250,372 | 583,223 | 42.9% |
| Tennessee | 227,511 | 268,918 | 84.6% |
| Iowa | 188,047 | 215,154 | 87.4% |
| Nebraska | 178,847 | 187,300 | 95.5% |
| Illinois | 167,466 | 185,836 | 90.1% |
| Total | 4,907,803 | 6,937,332 | 70.7% |
13.6.2 Agricultural field burning
The NEI uses numerous SCC to classify agricultural burns. Table 13.19 provides a national summary by SCC for the EPA default 2023 NEI emissions. A total of about 54,500 tons of PM2.5 are estimated to be emitted by this sector. Figure 13.13 provides a county map of agricultural burn PM2.5 emissions for year 2023 using the EPA methodology. Note higher emissions are estimated for portions of southern Florida and parts of California and Washington. Figure 13.14 provides monthly PM2.5 emissions for agricultural field burning in tons. Note emissions are smaller during the summer months with peaks in April, August and October. Table 13.20 lists the top ten states for PM2.5 emissions with Florida being the state with highest emissions. Shown in Table 13.21: are comparisons of PM2.5 emissions for those states that submitted PM2.5 vs EPA estimates. Only a few S/L/Ts submitted emissions.
| SCC | SCC Description | 2023 EPA-default PM2.5 emissions (tons) |
|---|---|---|
| 2801500000 | Agricultural Field Burning; Unspecified crop type | 14,738 |
| 2801500141 | Agricultural Field Burning; Field Crop is Bean (red) | 6,392 |
| 2801500150 | Agricultural Field Burning; Field Crop is Corn | 8,803 |
| 2801500151 | Agricultural Field Burning; Double Crop Winter Wheat and Corn | 46 |
| 2801500160 | Agricultural Field Burning; Field Crop is Cotton | 1,236 |
| 2801500171 | Agricultural Field Burning; Fallow | 2,891 |
| 2801500220 | Agricultural Field Burning; Field Crop is Rice | 2,250 |
| 2801500250 | Agricultural Field Burning; Field Crop is Sugar Cane | 1,882 |
| 2801500262 | Agricultural Field Burning; Field Crop is Wheat | 5,533 |
| 2801500263 | Agricultural Field Burning; Double Crop Winter Wheat and Cotton | 10 |
| 2801500264 | Agricultural Field Burning; Double Crop Winter Wheat and Soybeans | 1,345 |
| 2801540000 | Agricultural Field Burning - Ditch Burning | 1,508 |
| 2811020002 | Rangeland Burning | 7,928 |
| TOTAL | 54,562 |
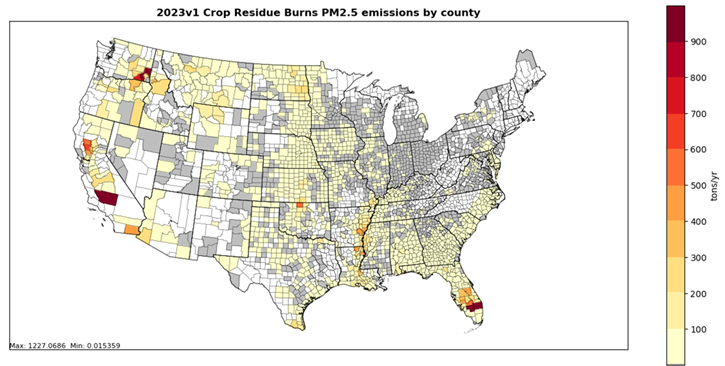
Figure 13.13: 2023 NEI annual, county PM2.5 emissions for crop residue burns
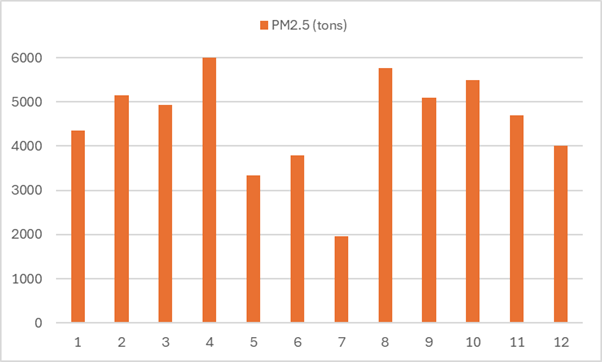
Figure 13.14: 2023 NEI monthly PM2.5 emissions (tons) for crop residue burns
| State Name | PM2.5 (tons) |
|---|---|
| Florida | 7,139 |
| California | 4,929 |
| Washington | 4,094 |
| Arkansas | 4,080 |
| Louisiana | 4,051 |
| North Dakota | 2,920 |
| Nebraska | 2,588 |
| Texas | 2,523 |
| Georgia | 2,251 |
| Kansas | 2,170 |
| State/Tribe | S/L/T-submitted | EPA-default |
|---|---|---|
| Maricopa County, AZ | 0 | 44 |
| Idaho | 1,038 | 907 |
| New Jersey | 50 | 20 |
| Washington | 3,056 | 4,094 |
| Nez Perce | 524 | Not available |