2.2 How is the NEI constructed?
Data in the NEI come from a variety of sources. The emissions are predominantly from S/L/T agencies for both CAP and HAP emissions. In addition, the EPA quality assures and augments the data provided by states to assist with data completeness, particularly with the HAP emissions since the S/L/T HAP reporting is voluntary.
The NEI is built by data category for point, nonpoint, nonroad mobile, and onroad mobile. Each data category contains emissions from various reporters in multiple datasets which are blended to create the final NEI “selection” for that data category. Each data category selection includes S/L/T data and numerous other datasets that are discussed in more detail in each of the following sections in this document. In general, S/L/T data take precedence in the selection hierarchy, which means that it supersedes any other data that may exist for a specific county/tribe/facility/process/pollutant. In other words, the selection hierarchy is built such that the preferred source of data, usually S/L/T, is chosen when multiple sources of data are available. There are exceptions to this general rule, which arise based on quality assurance checks and feedback from S/L/Ts that we will discuss in later sections.
The EPA uses augmentation and additional EPA datasets to create the most complete inventory for stakeholders, for use in such applications as AirToxScreen, air quality modeling, national rule assessments, international reporting, and other reports and public inquiries. Augmentation of S/L/T data, in addition to EPA datasets, fills in gaps for sources and/or pollutants that are often not reported by S/L/T agencies. The basic types of augmentation are discussed in the following sections.
2.2.1 Toxics Release Inventory Data
The “Toxics Release Inventory” (TRI) is an EPA database containing data on disposal or other releases including air emissions of over 650 toxic chemicals from 21,000 facilities. One of TRI’s primary purposes is to inform communities about toxic chemical releases to the environment. Data are submitted annually by U.S. facilities that meet TRI reporting criteria.
The EPA used air emissions data from the 2023 TRI to supplement point source HAP and NH3 emissions provided to EPA by S/L/T agencies. For 2023, all TRI emissions values that could reasonably be matched to an EIS facility with some certainty and with limited risk of double-counting nonpoint emissions were loaded into the EIS for viewing and comparison if desired. This totaled 8,263 facilities, covering over 95% of emissions in the TRI dataset. In most cases, TRI data is only included in the 2023 NEI for those pollutants that were not reported anywhere at the EIS facility by the S/L/T agency; a common exception to this practice is when we believe S/L/T data are in error, or include zero emissions where we believe TRI estimates are more appropriate. The point section of this TSD provides more information on how TRI data was used to supplement the point inventory.
2.2.2 Chromium Speciation
With the retirements of Chromium Trioxide (pollutant code = 1333820) and Chromic Acid (VI) (pollutant code = 7738945) in 2022, the 2023 reporting cycle included 3 valid pollutant codes for chromium, as shown in Table 2.2.
| Pollutant Code | Description | Pollutant Category Name | Speciated? |
|---|---|---|---|
| 16065831 | Chromium III | Chromium Compounds | yes |
| 18540299 | Chromium (VI) | Chromium Compounds | yes |
| 7440473 | Chromium | Chromium Compounds | no |
In the above table, chromium III and chromium (VI) are considered speciated, and so for clarity, chromium (pollutant 7440473) is referred to as “total chromium” in the remainder of this section. Total chromium could contain a mixture of chromium with different valence states. Since one key inventory use is for risk assessment, and since the valence states of chromium have very different risks, speciated chromium pollutants are the most useful pollutants for the NEI. Therefore, the EPA speciates S/L/T-reported and TRI-based total chromium into hexavalent chromium and non-hexavalent chromium. Hexavalent chromium, or Chromium (VI), is considered high risk and other valence states are not. Most of the non-hexavalent chromium is trivalent chromium (Chromium III); therefore, the EPA characterized all non-hexavalent chromium as trivalent chromium. The 2023 NEI does not contain any total chromium, only the speciated pollutants shown in Table 2.2.
This section describes the procedure we used for speciating chromium emissions from total chromium that was reported by S/L/T agencies.
We used the EIS augmentation feature to speciate S/L/T agency reported total chromium. For point sources, the EIS uses the following priority order for applying the factors:
- By Process ID
- By Facility ID
- By County
- By State
- By Emissions Type (for NP only)
- By SCC
- By Regulatory Code
- By NAICS
- A Default value if none of the others apply
If a particular emissions source of total chromium is not covered by the speciation factors specified by any of the first 8 attributes, a default value of 34 percent hexavalent chromium, 66 percent trivalent chromium is applied.
For the 2023 chromium augmentation, only the “By Facility ID” (2), “By SCC” (6), and “By Default” (9) were used on S/L/T-reported total chromium values. For TRI dataset chromium, the “By NAICS” (8) option was primarily used, although a small number of “By Facility” (2) occurrences were used rather than NAICS. The EIS generates and stores an EPA dataset containing the resultant hexavalent and trivalent chromium species. For all other data categories (e.g., nonpoint, onroad and nonroad), chromium speciation is performed at the SCC level.
This procedure generated hexavalent chromium (Chromium (VI)) and trivalent chromium (Chromium III), and it had no impact on S/L/T agency data that were provided as one of the speciated forms of chromium. The sum of the EPA-computed species (hexavalent and trivalent chromium) equals the mass of the total chromium (i.e., pollutant 7440473) submitted by the S/L/T agencies.
The EPA then used this dataset in the 2023 NEI selection by adding it to the data category-specific selection hierarchy and by excluding the S/L/T agency unspeciated chromium from the selection through a pollutant exception to the hierarchy.
Most of the speciation factors used in the 2023 NEI are SCC-based and are the same as were used in 2011 through 2020 NEI, based on data that has long been used by the EPA for air toxics analyses. However, some values are updated with every inventory cycle. New data may be developed by EPA during rule development or SLT HAP emissions review process. The speciation factors are accessed in the EIS through the reference data link “Augmentation Profile Information.” A chromium speciation “profile” is a set of output multiplication factors for a type of emissions source. The profile data for chromium are stored in the same tables as the HAP augmentation factors. The speciation factors are a specific case of HAP augmentation whereby the “output pollutants” are always hexavalent chromium and trivalent chromium, and the “input pollutant” is always chromium. There are 3 main tables and a summary table. The summary table excludes the metadata and comments regarding the derivation of the factors and assignment to SCCs; to learn more of the derivation of the factor or assignment of “profile” to a source, the main tables (not summary table) should be consulted.
The three main tables are:
- Augmentation Profile Names and Input Pollutants – general information about the profile and source of the profile names and factors.
- Augmentation Multiplication Factors – provides the output pollutants and multiplication factors associated with a given Augmentation Profile and input pollutant.
- Augmentation Assignments – provides the assignment of the profile to the data source (the list of 9 items above).
These tables are provided in the file “Chromium_Speciation_2023NEI_17apr2026.zip” on the “2023 NEI supplemental data FTP site”.
2.2.3 HAP Augmentation
The EPA supplements missing HAPs in S/L/T agency-reported data. HAP emissions are calculated by multiplying appropriate surrogate CAP emissions by an emissions ratio of HAP to CAP emission factors. For the 2023 NEI, we augmented HAPs for the point and nonpoint data categories. Generally, for point sources, the CAP-to-HAP ratios were computed using uncontrolled emission factors from the “WebFIRE database” (which contains primarily “AP 42” emissions factors). For nonpoint sources, the ratios were computed from the EPA-generated nonpoint data, which contain both CAPs and HAPs where applicable.
HAP augmentation is performed on each emissions source (i.e., specific facility and process for point sources, county and process level for nonpoint sources) using the same EIS augmentation feature as described in chromium speciation. However, unlike chromium speciation, there is no default augmentation factor so that not every process that has S/L/T CAP data will end up with augmented HAP data.
HAP augmentation input pollutants are S/L/T-submitted VOC, PM10-PRI, PM25-PRI, SO2, and PM10-FIL. The resulting output can be a single output pollutant or a full suite of output pollutants. Not every source that has a CAP undergoes HAP augmentation (i.e., livestock NH3 and fugitive dust PM25-PRI). The sum of the HAP augmentation factors typically does not equal 1 (100%) because not all the VOC or PM mass will be HAP. We try to ensure that the sum of HAP-VOC factors is less than 1 because it can’t be more, but it is sometimes close or equal to 1. HAP augmentation factors based on PM mass are typically much less than 1 for almost all SCCs. HAP augmentation factors are grouped into profiles that contain unique output pollutant factors related to a type of source. Assigning these profiles to the individual sources depends on the source attributes, commonly the SCC.
There are business rules specific to each data category discussed in the point and nonpoint sections of the TSD. The goal is to prevent double-counting of HAP emissions between S/L/T data and the EPA HAP augmentation output, and to prevent, where possible, adding HAP emissions to S/L/T-submitted processes that are not desired. NEI developers use their judgment on how to apply HAP augmentation to the resulting NEI selection.
Caveats
HAP augmentation has limitations; HAP and CAP emission factors from WebFIRE do not necessarily use the same test methods. In some situations, the VOC emission factor is less than the sum of the VOC HAP emission factors. In those situations, we normalize the HAP ratios so as not to create more VOC HAPs than VOC. We are also aware that there are many similar SCCs that do not always share the same set of emission factors/output pollutants. We do not apply ratios based on emission factors from similar SCCs other than for mercury from combustion SCCs. We would prefer to get HAPs reported from S/L/T agencies or from facility reports to the Toxics Release Inventory, but HAP augmentation is used as the last available option. Compliance test data does not usually provide an annual emissions total.
Because most AP-42 factors are 20+ years old, many incremental edits to these factors have been made over time. We have removed some factors based on results of various air toxics assessments. For example, we discovered ethylene dichloride was being augmented for SCCs related to gasoline distribution. This pollutant was associated with leaded gasoline which is no longer used. Therefore, we removed it from our HAP augmentation between 2011 NEI v2 and 2014. We also received specific facility and process augmentation factors resulting from Air Toxics analyses. More discussion of the underlying data used for the 2023 NEI Point inventory is discussed in the point section of the TSD.
For point sources, HAPs augmentation data are not used when S/L/T air agency data exists at any process at the facility for the same pollutant. That means that if a S/L/T reports a particular HAP at some processes but misses others, then those other processes will not be augmented with that HAP. The HAP Augmentation Profile Names with input pollutants, multiplication factors, and profile assignments are provided in the file “HAP_Augmentation_2023NEI_17apr2026.zip” on the “2023 NEI supplemental data FTP site”.
2.2.4 Particulate Matter Augmentation
Particulate matter (PM) emissions species in the NEI are primary PM10 (pollutant code PM10-PRI in the EIS and NEI) and primary PM2.5 (PM25-PRI), filterable PM10 and filterable PM2.5 (PM10-FIL and PM25-FIL) and condensable PM (PM-CON). The EPA needs to augment the S/L/T agency PM components for the point and nonpoint inventories to ensure completeness of the PM components in the final NEI. In general, emissions for PM components missing from S/L/T agency inventories were calculated by applying factors to the PM emissions data supplied by the S/L/T agencies.
PM Augmentation is only run in EIS for point and nonpoint sources. Unlike the PM calculator/Augmentation tool used in the 2017 and previous NEIs, EIS PM Augmentation only gap-fills missing PM components, and does not overwrite existing S/L/T PM data, which already undergoes rudimentary EIS QA checks as the data is being loaded into EIS.
The complete set of conditional logic statements used in EIS PM Augmentation are displayed in Figure 2.1. The PM Augmentation Profile Names with input pollutants, multiplication factors, and profile assignments are provided in the file “PM_Augmentation_2023NEI_17apr2026.zip” on the “2023 NEI supplemental data FTP site”.
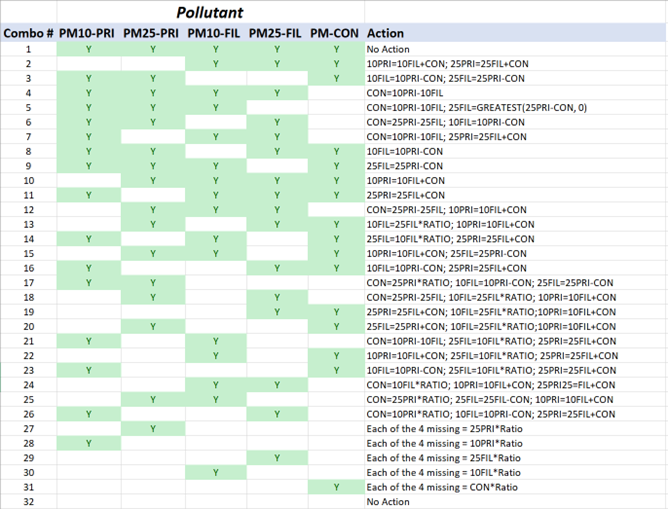
Figure 2.1: PM Augmentation computations based on S/L/T submitted pollutants
2.2.5 Other EPA Datasets
In addition to TRI, chromium speciation, HAP and PM augmentation, the EPA generates other data to produce a complete inventory. Starting with the 2020 NEI, as part of the NEI selection process, EIS generates speciated PM2.5 emissions for all sources with PM emissions. These PM species are a result of speciation where the NEI PM25-PRI emissions are split into five PM2.5 species: elemental (also referred to as “black”) carbon (EC), organic carbon (OC), nitrate (NO3), sulfate (SO4), and the remainder of PM25-PRI (PMFINE). In addition, a copy of PM25-PRI and PM10-PRI from mobile source diesel engines, relabeled as DIESEL-PM25 and DIESEL-PM10, respectively, are also generated.
Examples of other EPA data for point sources include landfills, railyards, electric generating units (EGUs), and aircraft.
2.2.6 Data Tagging
S/L/T agency data generally is used first when creating the NEI selection. When S/L/T data are used, then the NEI would not use other data (primarily EPA data from stand-alone datasets or HAP, PM or TRI augmentation) that also may exist for the same process/pollutant. Thus, in most cases the S/L/T agency data are used; however, for several reasons, sometimes we need to exclude, or “tag out” S/L/T agency data. Examples of these “S/L/T tags” are when S/L/T agency staff alert the EPA to exclude their data (because of a mistake or outdated value), or when EPA staff find problems with submitted data. Another example is when S/L/T emissions data are significantly less than TRI and are presumed to be incomplete, which can happen for S/L/T that use automated gap-filling procedures for facilities that do not voluntarily provide HAP emissions. These automated procedures gap-fill only for processes that have emission factors and miss processes/pollutants that may have been reported to TRI using other means besides published emission factors.
In previous NEI years data tagging had also been used to avoid double-counting emissions by using emissions from more than one dataset because the two datasets were at different levels of granularity and thus not able to be integrated to the full process level of detail required by the standard selection hierarchy software. The primary example of this is the TRI dataset, which provides facility-total emissions rather than individual process-level emissions. Because the TRI emissions must be stored to a single emission process that is not the same as that used by the S/L/T agency, the standard hierarchy selection software would use both. Thus, tagging was used to “block” any TRI values where the S/L/T had reported the same pollutant at any process(es) within the same facility. Since the 2017 NEI, a series of additional rules were added to the selection hierarchy to avoid such tagging. Point source datasets are identified as being either Process-level, Unit-level, or Facility-level granularity, and the selection software now uses those identifications to avoid double-counting, avoiding the need for those types of tags.
2.2.7 Inventory Selection
Once all S/L/T and EPA data are quality assured in the EIS, and all augmentation and data tagging are complete, then we use the EIS to create a data category-specific inventory selection. To do this, each EIS dataset is assigned a priority ranking prior to running the selection with EIS. The EIS then performs the selection at the most detailed inventory resolution level for each data category. For point sources, this is the process and pollutant level. For nonpoint sources, it is the process (SCC)/shape ID (i.e., ports) and pollutant level. For onroad and nonroad sources, it is process/pollutant. At these resolutions, the inventory selection process uses data based on highest priority and excludes data where it has been tagged. Selection rules are also applied to each data category selection; these are discussed in detail within each TSD section for these categories: Section 3 for Point sources, Section 4 for Nonroad Mobile, Section 5 for Onroad, and Section 6 for Nonpoint sources. The EPA then quality assures this final blended inventory to ensure expected processes/pollutants are included or excluded. The EIS uses the inventory selection to also create the SMOKE Flat Files, EIS reports, and data that appear on the NEI website.