2.7 What does the 2023 NEI tell us about mercury?
The NEI documentation includes this Hg section because of the importance of this pollutant and because the sectors used to categorize Hg are different than the sectors presented for the other pollutants. The Hg sectors primarily focus on regulatory categories and categories of interest to the international community; emissions are summarized by these categories at the end of this section, in Table 2.10.
A summary of all data sources used to create the 2023 Hg inventory is shown in Figure 2.4.

Figure 2.4: Data sources of Hg emissions (tons) in the 2023 NEI, by data category.
Mercury emission estimates in the 2023 NEI sum to 29.3 tons, with 28.9 tons from stationary sources and 0.4 tons from mobile sources (including aircraft, commercial marine vessels and locomotives). In the above figure the “EPA mobile” accounts for all EPA datasets in the onroad mobile and nonroad mobile data categories: onroad mobile and nonroad equipment sources; this does not include emissions from commercial marine vessel and locomotive (also referred to as rail) emissions which reside in the EPA Nonpoint dataset.
Due to large decreases of emissions from sources within the regulated categories, most of the emissions are from sources other than the regulated categories. The “other” includes but is not limited to, landfills, primary and secondary metal production, gas turbines, chemical manufacturing processes, production of gypsum and other mineral products, flash steam geothermal power plants, petroleum refineries, human cremation, residential fuel combustion, and fluorescent lamp breakage. Of the regulatory categories trended, the three with highest emissions in the 2023 NEI are: electric arc furnaces (4.3 tons), coal -fired EGU with units larger than 25 megawatts (MW) (2.7 tons), Portland cement production (1.5 tons), and boilers and process heaters (1.3 tons). Since the 2017 NEI, coal-fired EGUs no longer comprise the largest portion of the mercury emissions in NEI.
Mercury emissions from coal and oil-fired electric generating units subject to the Mercury and Air Toxics Standards (MATS) [ref 3] originate from SLT submitted mercury emissions estimates. A very small fraction originates from the TRI dataset. An insignificant fraction is derived from HAP augmentation.
In addition to Figure 2.4, Table 2.8 lists the emissions by data source with the above data sets further broken out. More information on these datasets are available in the point, nonroad mobile, onroad mobile, and nonpoint ssections of this TSD.
| Data Category | Data Set | Brief Description | Hg Emissions (tons) |
|---|---|---|---|
| Point | S/L/T | State, local, tribal agency-submitted | 14.98 |
| Point | 2023EPA_TRI | Toxics Release Inventory | 3.89 |
| Point | 2023EPA_HAPAug | Computed based on S/L/T CAPs | 0.30 |
| Point | 2023EPA_HAPAug-PMAug | Computed based on S/L/T Augmented PM | 0.08 |
| Point | 2023EPA_LF | Landfills | 0.02 |
| Point | 2023EPA_RailHAPAug | Computed based on EPA Rail PM | 0.00 |
| Nonpoint | 2023EPA_NONPOINT | All EPA nonpoint tool estimates, including commercial marine vessels and rail lines | 9.17 |
| Nonpoint | 2023EPA_HAPAug | Computed based on S/L/T CAPs | 0.23 |
| Nonpoint | S/L/T | State, local, tribal agency-submitted | 0.21 |
| Nonpoint | 2023EPA_HAPAug-PMAug | Computed based on S/L/T Augmented PM | 0.02 |
| Nonpoint | 2023EPA_HAPAug_EPANP | Computed based on EPA Tool PM | 0.01 |
| Onroad | 2023EPA_Onroad | EPA MOVES model | 0.35 |
| Nonroad | 2023EPA_Nonroad | EPA MOVES model | 0.04 |
| Total | 29.28 |
The point and nonpoint data category datasets are described in more detail in their respective sections of this TSD, and we highlight some key datasets here.
For point sources, we gap-filled Hg that was not reported by S/L/Ts in the same way as other HAPs – including use of the TRI, EPA HAP Augmentation or “HAP Aug” in the figure, and other EPA data developed for gap filling. Electric arc furnaces (EAFs) were gap filled using HAP Aug and TRI only. The HAP augmentation used facility specific augmentation factors developed so that the resultant emissions would be the same as computed in the NEI since 2014. This approach was used to provide a more automated approach than to submit the same emissions year after year, that would (via the use of CAPs) account for changes in activity. The 2014 estimates were developed by applying a 34% reduction to 2011 NEI emissions (process level). The 2011 NEI emissions were based on data developed for the National Emission Standards for Hazardous Air Pollutants (NESHAP) for Area Sources: Electric Arc Furnace Steelmaking Facilities (subpart YYYYY). The 34% value was the average reduction from a limited 3 facility test program in 2016 (the range was 11-70%) -based on personal communication with Donna Lee Jones, EPA lead for the NESHAP. We have used the same approach since the 2014 NEI for using TRI data associated EAFs in that we excluded S/L/T estimates at non-EAF processes if they were significantly lower than the TRI Hg value. The largest contribution to total EAF emissions is S/L/T data which sum to about 3.33 tons. The sum of TRI Hg for EAFs is about 0.78 tons. EAF emissions from HAP Augmentation is about 0.15 tons.
The nonpoint non-combustion-related and cremation categories used the same or very similar approaches as were used since the 2014 NEI, though activity data was updated. These nonpoint non-combustion mercury methodologies are described in Section 15. EPA estimates for these categories are included in the “2023EPA_NONPOINT” (along with other EPA nonpoint category estimates) shown in Figure 2.4 and Table 2.8. Some of these categories have a point contribution, though the specific categories do not exactly line up between the nonpoint and point data categories. They are summarized below:
- switches and relays – emissions from the shredding and crushing of cars containing Hg components at auto crushing yards, SCC = 2650000002: Waste Disposal, Treatment, and Recovery; Scrap and Waste Materials; Scrap and Waste Materials; Shredding (1.39 tons nonpoint; 14.4 lbs point)
- landfill “working face” emissions associated with the release of mercury via churning/crushing of new material added to the landfill, SCC= 2620030001: Waste Disposal, Treatment, and Recovery; Landfills; Municipal; Dumping/Crushing/Spreading of New Materials (working face) (0.914 tons nonpoint, total point landfill Hg is 0.20 tons)
- thermometers and thermostats – the portion that emit mercury prior to disposal at landfills or incinerators, SCC=2650000000: Waste Disposal, Treatment, and Recovery; Scrap and Waste Materials; Scrap and Waste Materials; Total: All Processes (0.118 tons nonpoint)
- dental amalgam – emissions at dentist offices and from evaporation in teeth, SCC=2850001000: Miscellaneous Area Sources; Health Services; Dental Alloy Production; Overall Process (0.45 tons nonpoint)
- general laboratory activities, SCC = 2851001000: Miscellaneous Area Sources; Laboratories; Bench Scale Reagents; Total (0.052 tons nonpoint)
- fluorescent lamp breakage, SCC= 2861000000: Miscellaneous Area Sources; Fluorescent Lamp Breakage; Non-recycling Related Emissions; Total (0.947 tons nonpoint)
- fluorescent lamp recycling, SCC= 2861000010: Miscellaneous Area Sources; Fluorescent Lamp Breakage; Recycling Related Emissions; Total (less than 0.1 lb nonpoint, point sum of breakage and recycling less than 0.01 lbs)
- animal cremation, SCC= Miscellaneous Area Sources; Other Combustion; Cremation; Animals (4.49 lbs nonpoint, 80.0 lbs point)
- human cremation – emissions primarily due to mercury in dental amalgam, SCC=2810060100: Miscellaneous Area Sources; Other Combustion; Cremation; Humans (2.82 tons nonpoint, 264.8 lbs point). This is a 22% increase from 2020 emissions.
Since mercury is a HAP, it is reported voluntarily by S/L/T agencies. For the point data category of the 2023 NEI, 48 states and 6 local agencies reported mercury emissions. Table 2.9 provides the tons of emissions from EPA, the SLT, and the resulting percent of emissions for the point data category.
| State | Agency | Agency Type | From EPA (lbs) | From Agency (lbs) | Total (lbs) | Percent from Agency |
|---|---|---|---|---|---|---|
| AK | Alaska Department of Environmental Conservation | State | 84.80 | NA | 84.80 | 0.00% |
| AL | Alabama Department of Environmental Management | State | 292.54 | 1507.42 | 1799.96 | 83.70% |
| AR | Arkansas Department of Environmental Quality | State | 901.14 | 1042.19 | 1943.34 | 53.60% |
| AZ | Arizona Department of Environmental Quality | State | 10.54 | 259.39 | 269.93 | 96.10% |
| AZ | Maricopa County Air Quality Department | Local | 160.77 | NA | 160.77 | 0.00% |
| CA | California Air Resources Board | State | 46.17 | 1982.70 | 2028.87 | 97.70% |
| CO | Colorado Department of Public Health and Environment | State | 361.16 | 45.00 | 406.16 | 11.10% |
| CT | Connecticut Department of Energy and Environmental Protection | State | 0.22 | 120.72 | 120.94 | 99.80% |
| DC | DC-District Department of the Environment | State | 1.69 | 34.99 | 36.68 | 95.40% |
| DE | Delaware Department of Natural Resources and Environmental Control | State | 0.14 | 31.93 | 32.07 | 99.60% |
| FL | Florida Department of Environmental Protection | State | 192.98 | 828.24 | 1021.22 | 81.10% |
| GA | Georgia Department of Natural Resources | State | 250.93 | 4.17 | 255.10 | 1.60% |
| GU | Guam County | Territory | 3.11 | NA | 3.11 | 0.00% |
| HI | Hawaii Department of Health Clean Air Branch | State | 28.56 | 46.78 | 75.34 | 62.10% |
| IA | Iowa Department of Natural Resources | State | 68.55 | 584.07 | 652.61 | 89.50% |
| ID | Idaho Department of Environmental Quality | State | 705.98 | 5.52 | 711.50 | 0.80% |
| IL | Illinois Environmental Protection Agency | State | 285.65 | 518.99 | 804.64 | 64.50% |
| IN | Indiana Department of Environmental Management | State | 829.55 | 1903.20 | 2732.75 | 69.60% |
| KS | Kansas Department of Health and Environment | State | 17.67 | 654.66 | 672.33 | 97.40% |
| KY | Kentucky Division for Air Quality | State | 159.73 | 256.41 | 416.14 | 61.60% |
| KY | Louisville Metro Air Pollution Control District | Local | 0.10 | 79.25 | 79.35 | 99.90% |
| LA | Louisiana Department of Environmental Quality | State | 974.67 | 273.52 | 1248.19 | 21.90% |
| MA | Massachusetts Department of Environmental Protection | State | 21.43 | 2.00 | 23.43 | 8.50% |
| MD | Maryland Department of the Environment | State | 234.97 | NA | 234.97 | 0.00% |
| ME | Maine Department of Environmental Protection | State | 0.01 | 99.93 | 99.93 | 100.00% |
| MI | Michigan Department of Environmental Quality | State | 21.89 | 459.72 | 481.61 | 95.50% |
| MN | Minnesota Pollution Control Agency | State | 0.14 | 908.30 | 908.44 | 100.00% |
| MO | Missouri Department of Natural Resources | State | 68.83 | 869.12 | 937.95 | 92.70% |
| MS | Mississippi Dept of Environmental Quality | State | 5.84 | 431.80 | 437.64 | 98.70% |
| MT | Montana Department of Environmental Quality | State | 124.40 | 6.80 | 131.20 | 5.20% |
| NC | North Carolina Department of Environmental Quality | State | 16.31 | 1070.69 | 1086.99 | 98.50% |
| ND | North Dakota Department of Environmental Quality | State | 761.80 | 288.99 | 1050.79 | 27.50% |
| NE | Nebraska Environmental Quality | State | 25.57 | 266.82 | 292.39 | 91.30% |
| NH | New Hampshire Department of Environmental Services | State | 0.09 | 21.37 | 21.46 | 99.60% |
| NJ | New Jersey Department of Environment Protection | State | 1.46 | 119.38 | 120.85 | 98.80% |
| NM | City of Albuquerque | Local | 38.06 | 27.08 | 65.14 | 41.60% |
| NM | New Mexico Environment Department Air Quality Bureau | State | 0.88 | 8.00 | 8.88 | 90.10% |
| NV | Clark County Department of Air Quality and Environmental Management | Local | 7.37 | NA | 7.37 | 0.00% |
| NV | Nevada Division of Environmental Protection | State | 288.84 | 535.67 | 824.51 | 65.00% |
| NV | Washoe County Health District | Local | 0.00 | NA | 0.00 | 0.00% |
| NY | New York State Department of Environmental Conservation | State | 1.20 | 497.24 | 498.44 | 99.80% |
| OH | Ohio Environmental Protection Agency | State | 221.22 | 3597.95 | 3819.18 | 94.20% |
| OK | Oklahoma Department of Environmental Quality | State | 31.44 | 414.70 | 446.14 | 93.00% |
| OR | Oregon Department of Environmental Quality | State | 9.68 | 195.00 | 204.68 | 95.30% |
| PA | Pennsylvania Department of Environmental Protection | State | 444.92 | 1507.75 | 1952.67 | 77.20% |
| PR | Puerto Rico | Territory | 97.65 | NA | 97.65 | 0.00% |
| RI | Rhode Island Department of Environmental Management | State | 1.88 | 59.40 | 61.28 | 96.90% |
| SC | South Carolina Department of Health and Environmental Control | State | 0.13 | 1645.17 | 1645.31 | 100.00% |
| SD | South Dakota Department of Environment and Natural Resources | State | 48.53 | NA | 48.53 | 0.00% |
| TN | Chattanooga Air Pollution Control Bureau (CHCAPCB) | Local | 27.00 | 0.00 | 27.00 | 0.00% |
| TN | Knox County Department of Air Quality Management | Local | 91.10 | 24.00 | 115.10 | 20.90% |
| TN | Memphis and Shelby County Health Department - Pollution Control | Local | 242.88 | 7.76 | 250.64 | 3.10% |
| TN | Metro Public Health of Nashville/Davidson County | Local | 0.03 | 0.20 | 0.23 | 85.70% |
| TN | Tennessee Department of Environmental Conservation | State | 106.64 | 138.70 | 245.35 | 56.50% |
| TX | Texas Commission on Environmental Quality | State | 39.91 | 4042.15 | 4082.06 | 99.00% |
| UT | Utah Division of Air Quality | State | 1.24 | 639.21 | 640.45 | 99.80% |
| VA | Virginia Department of Environmental Quality | State | 47.67 | 555.60 | 603.27 | 92.10% |
| VT | Vermont Department of Environmental Conservation | State | 1.26 | 0.27 | 1.53 | 17.80% |
| WA | Washington State Department of Ecology | State | 68.79 | 50.35 | 119.14 | 42.30% |
| WI | Wisconsin Department of Natural Resources | State | 7.60 | 261.97 | 269.57 | 97.20% |
| WV | West Virginia Division of Air Quality | State | 42.97 | 387.87 | 430.83 | 90.00% |
| WY | Wyoming Department of Environmental Quality | State | 0.40 | 641.25 | 641.65 | 99.90% |
| NA | Gila River Indian Community | Tribe | 0.01 | NA | 0.01 | 0.00% |
| NA | Navajo Nation | Tribe | 26.90 | NA | 26.90 | 0.00% |
| NA | Nez Perce Tribe | Tribe | 0.06 | NA | 0.06 | 0.00% |
| NA | Salt River Pima Maricopa Indian Community (SRPMIC) EPNR | Tribe | 0.02 | NA | 0.02 | 0.00% |
| NA | Southern Ute Indian Tribe | Tribe | 0.00 | NA | 0.00 | 0.00% |
| NA | Tohono O-Odham Nation Reservation | Tribe | 0.01 | NA | 0.01 | 0.00% |
| NA | Ute Indian Tribe of the Uintah & Ouray Reservation, Utah | Tribe | 0.40 | NA | 0.40 | 0.00% |
Nine states (CA, MD, MN, NC, OH, OK, TX, VA, and WV) and two local agencies (Knox County, TN and Washoe County, NV) reported Hg to the nonpoint data category.
Table 2.10 and Figure 2.5 show the 2023 NEI mercury emissions for the key categories of interest in comparison to other triennial inventory years and the baseline HAP inventory of 1990. The 2005 data are from the MATS “2005 modeling platform”. Data used for appending 2023 NEI estimates to these key categories is provided in the “2023NEI Hg Cat for TSD.xlsx” workbook in the zip file “2023NEI_supplemental_data_Hg_Section2_TSD_18may26.zip” on the “2023 NEI supplemental data FTP site”. Specifically, the sheet “2023 XWALK ProcID-Category” provides the category assignments for each 2023 EIS process ID, and “2020NP NEI categories + new2023” the crosswalk for matching nonpoint and mobile SCCs to categories. The previous triennial NEI (2020 NEI) was used as a starting point, and then supplemented with manual assignments considering SCC, NAICS, facility category codes, regulatory codes, emission factor information (e.g., fuel combusted), and facility names.
| Source Category | 1990 (tpy) | 2005 (tpy) | 2008 (tpy) | 2011 (tpy) | 2014 (tpy) | 2017 (tpy) | 2020 (tpy) | 2023 (tpy) | Notes |
|---|---|---|---|---|---|---|---|---|---|
| Utility Coal Boilers (Electricity Generation Units – EGUs, combusting coal) | 58.8 | 52.2 | 29.40 | 26.80 | 22.90 | 4.40 | 3.60 | 2.70 | This category includes coal-fired utility boilers and integrated gasified coal combustion units greater than 25 MW, excluding small Hg estimated for startup or cofired gas/oil. The following utility and independent power plant units are included in the “Other” category: non-coal fired boilers, coal fired boilers <25MW, gas turbines, geothermal units, and combined cycle units). |
| Hospital, Medical, Infectious Waste Incineration | 51.0 | 0.2 | 0.10 | 0.10 | 0.02 | 0.00 | 0.01 | 0.01 | NA |
| Municipal Waste Combustors | 57.2 | 2.3 | 1.30 | 1.00 | 0.60 | 0.40 | 0.30 | 0.30 | NA |
| Industrial, Commercial & Institutional (ICI) Boilers and Process Heaters | 14.4 | 6.4 | 4.20 | 3.60 | 3.20 | 2.50 | 1.40 | 1.30 | Sum of nonpoint ICI boiler and point emissions. Change in category: Previously included some electricity generating units less than 25 MW. Since 2020, this category includes strictly industrial units and industrial cogenerating units. Electricity generating units other than those in the Utility Coal Boilers category are now included in the “Other” category along with large non-coal fired electric generating units. Decrease from 2017 to 2020 is due in part to this change in category definition. |
| Mercury Cell Chlor-Alkali Plants | 10.0 | 3.1 | 1.30 | 0.50 | 0.10 | 0.10 | 0.10 | 0.04 | NA |
| Electric Arc Furnaces | 7.5 | 7.0 | 4.80 | 5.40 | 5.00 | 4.70 | 3.80 | 4.30 | NA |
| Commercial & Industrial Sold Waste Incineration | NA | 1.1 | 0.02 | 0.01 | 0.01 | 0.06 | 0.03 | 0.07 | NA |
| Hazardous Waste Incineration | 6.6 | 3.2 | 1.30 | 0.70 | 0.80 | 1.00 | 0.20 | 0.30 | NA |
| Portland Cement Non-Hazardous Waste | 5.0 | 7.5 | 4.20 | 2.90 | 3.20 | 1.70 | 1.60 | 1.50 | NA |
| Gold Mining | 4.4 | 2.5 | 1.70 | 0.80 | 0.60 | 0.90 | 0.90 | 0.40 | Includes fugitive emissions at mines such as TRI emissions at fugitive release points that were not reported by S/L/T |
| Sewage Sludge Incineration | 2.0 | 0.3 | 0.30 | 0.30 | 0.30 | 0.40 | 0.20 | 0.20 | NA |
| Mobile Sources | NA | 1.2 | 1.80 | 1.30 | 1.00 | 0.60 | 0.50 | 0.40 | Sum of all onroad, nonroad, locomotives and commercial marine vessels. |
| Other Categories | 29.5 | 18.0 | 10.70 | 13.00 | 14.00 | 16.00 | 16.90 | 18.00 | Sum of nonpoint {ICI fuel combustion other than boilers, residential fuel combustion, industrial processes, cremation, dental alloy production, fluorescent lamp breakage} and point emissions. Increase due in part to inclusion of electric generating units previously included in the ICI Boilers and Process Heaters Category. |
| Total (all categories) | 246.0 | 105.0 | 61.00 | 56.00 | 52.00 | 33.00 | 30.00 | 29.00 | NA |

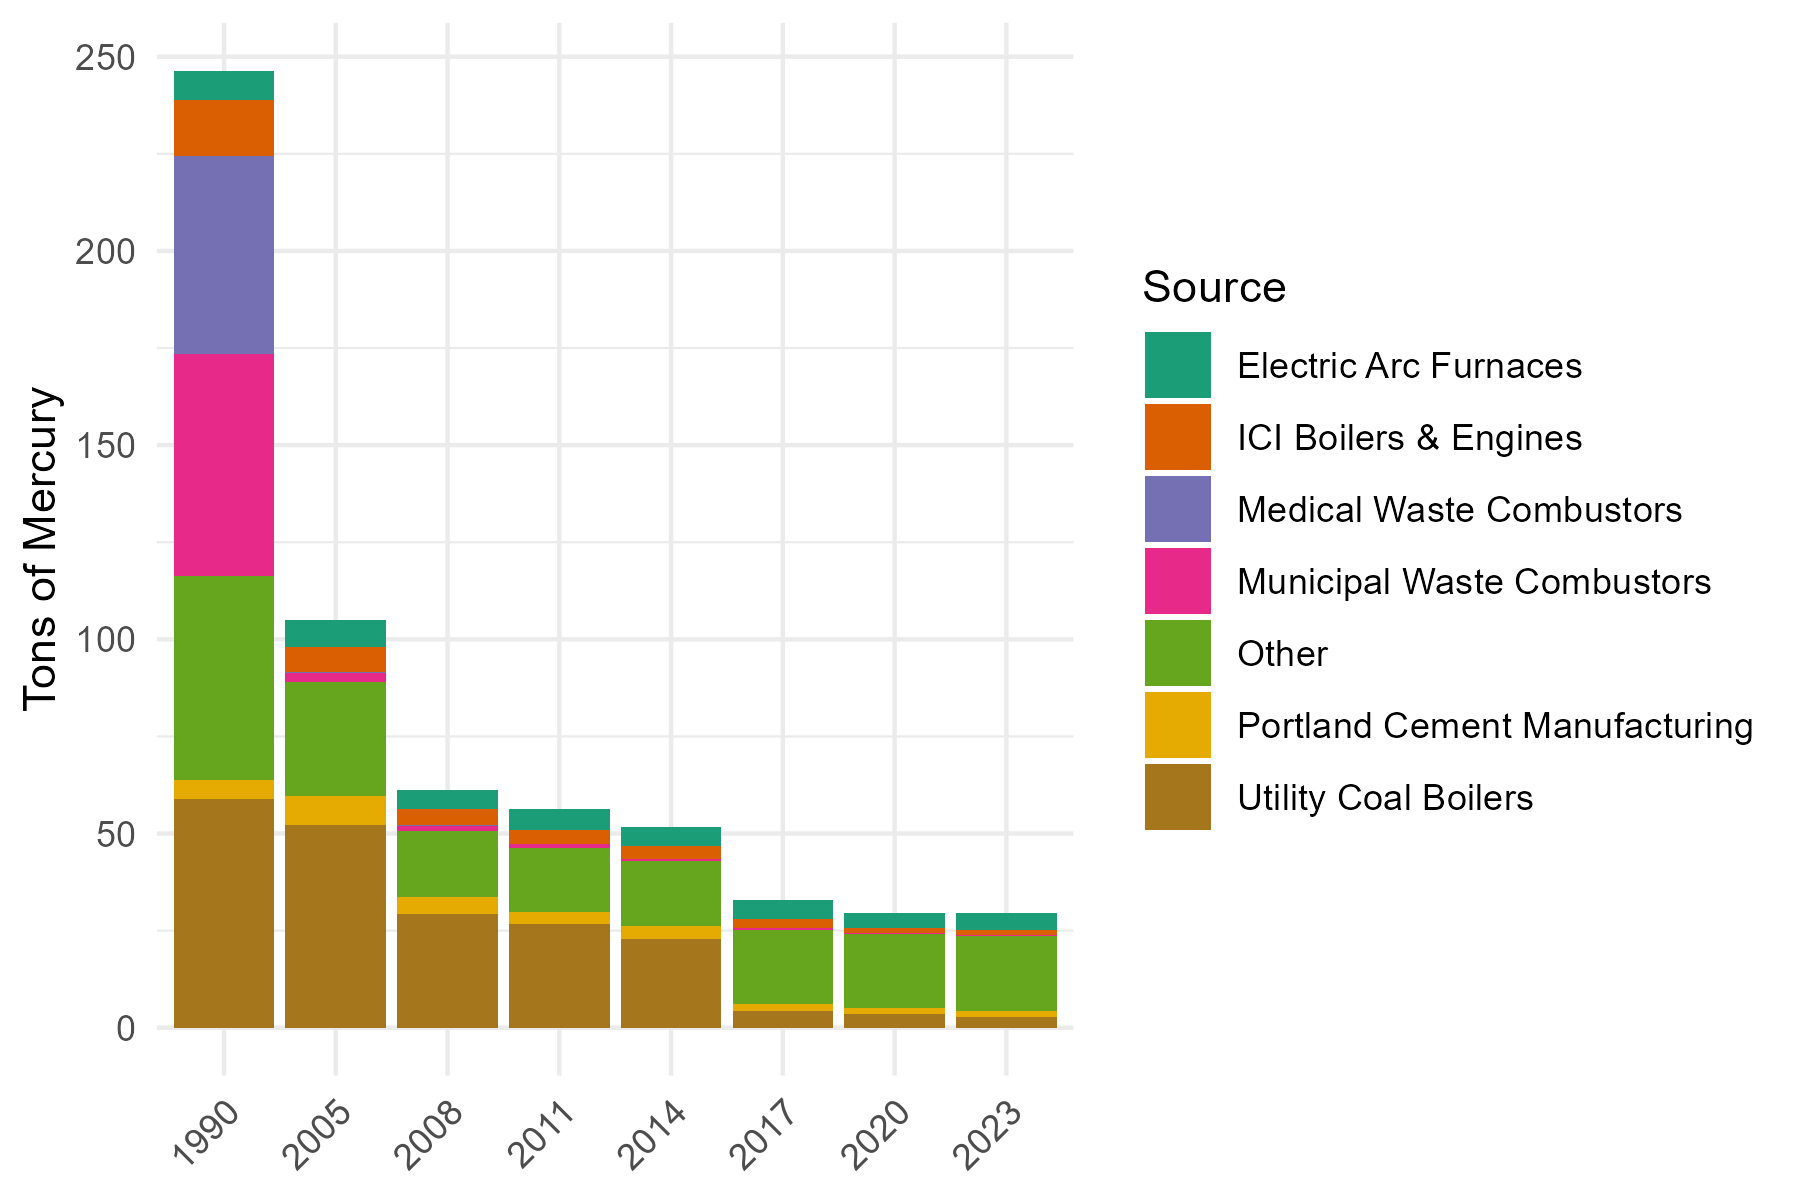
Figure 2.5: Trends in NEI Mercury emissions
As shown in Table 2.10, 2023 Hg emissions are essentially unchanged in 2023 versus 2020, and about 3 tons lower than in the 2017. While EGU emissions continued to decrease in 2023 (2.7 tons vs 3.6 tons in 2020), emissions for electric arc furnaces and “Other” sources (i.e., human cremation) increased slightly, essentially offsetting the decrease in EGU estimates. For EGUs, the decrease is a combination of fuel switching to natural gas, the installation of Hg controls to comply, and the co-benefits of Hg reductions from control devices installed for the reduction of SO2 and PM.