7.1 EPA-developed emissions
7.1.1 Conterminous U.S.
The biogenic emissions for the 2023 National Emissions Inventory (NEI) were computed based on 2023 meteorology data from the Weather Research and Forecasting (WRF) model version 4.4.2 (WRFv4.4.2) and using the Biogenic Emission Inventory System, version 4 (BEIS4) model within the Sparse Matrix Operator Kernel Emissions (SMOKE) modeling system version 5.1. The BEIS4 model creates gridded, hourly, model-species emissions from vegetation and soils at 12-kilometer horizontal resolution. The 12-kilometer gridded hourly data are summed to monthly and annual level and are mapped from 12-kilometer grid cells to counties using a standard mapping file. Figures 7.1, 7.2, and 7.3 provide county emissions density maps for all 3 SCCs.
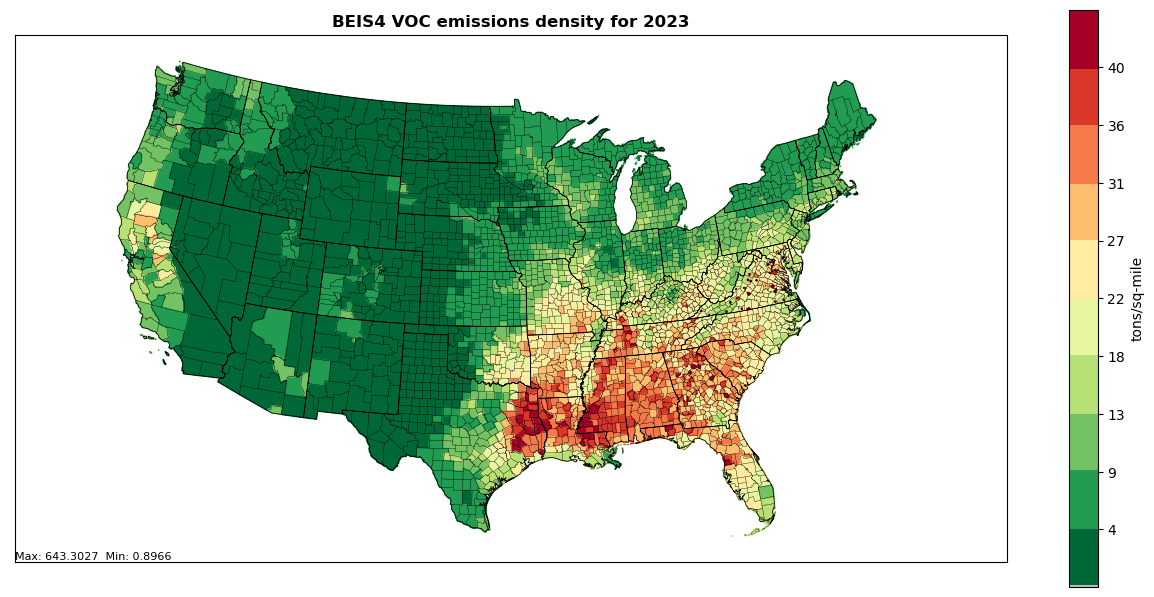
Figure 7.1: Annual VOC County emissions density map for year 2023 (tons per square mile) for SCC 270120000
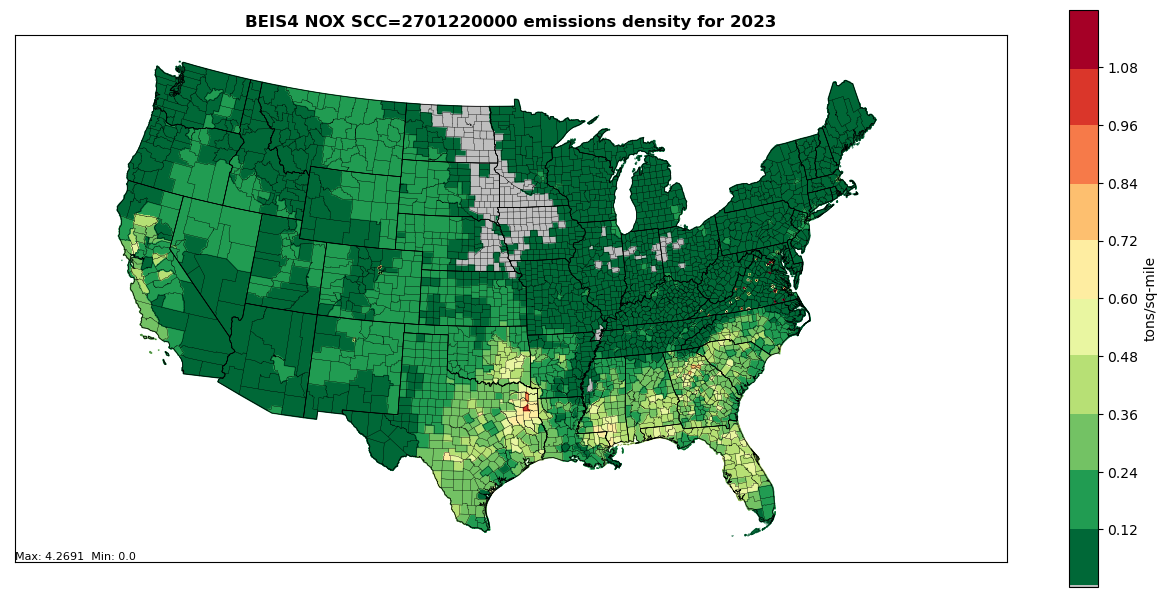
Figure 7.2: Annual NOX County emissions density map for year 2023 (tons per square mile) for SCC 2701220000
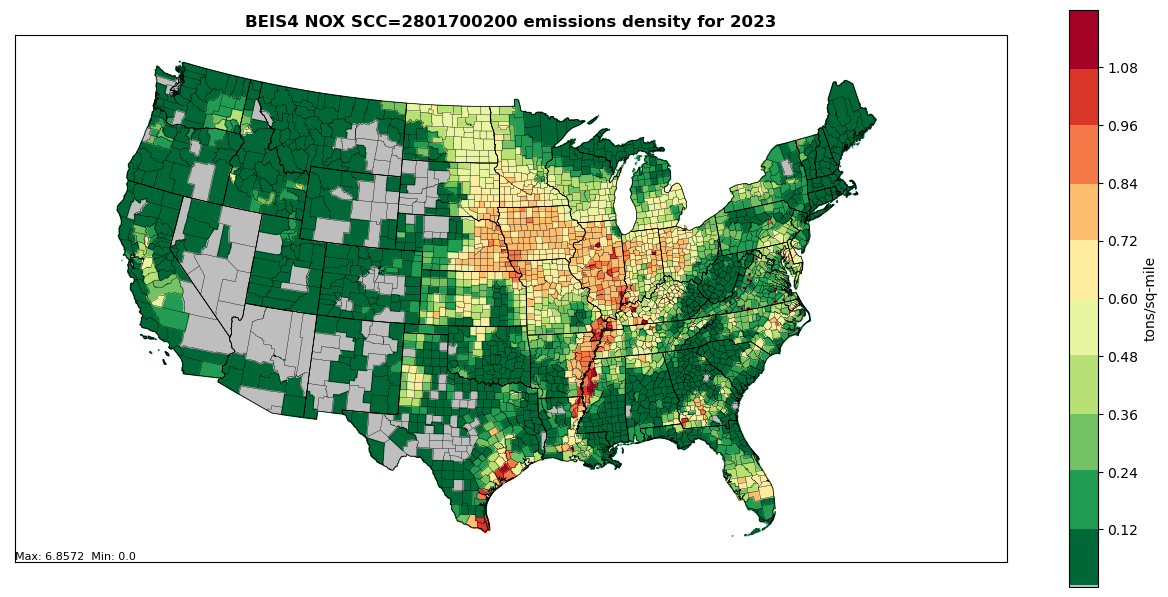
Figure 7.3: Annual NOX County emissions density map for year 2023 (tons per square mile) for SCC 2801700200
BEIS produces biogenic emissions for a modeling domain which includes the contiguous 48 states in the U.S., parts of Mexico, and Canada. The NEI uses the biogenic emissions from counties from the contiguous 48 states and Washington, DC. The model-species are those associated with the Carbon Bond mechanism version 6 (CB6). The NEI pollutants produced are CO, VOC, NOx, methanol, formaldehyde and acetaldehyde. VOC is the sum of all biogenic species except CO and nitrogen oxide (NO). Mapping of BEIS species to NEI pollutants is as follows:
NO maps to NOx
FORM maps to formaldehyde
ALD2 maps to acetaldehyde
MEOH maps to methanol
VOC is the sum of all biogenic species except CO and NO
BEIS4 has some important updates from earlier versions of BEIS. These include the incorporation of Version 6 of the Biogenic Emissions Landuse Database (BELD6), the option to include seasonality of emissions using the 1-meter soil temperature (SOIT2) instead of the BIOSEASON file, and canopy temperature and radiation environments are now modeled using the driving meteorological model’s (WRFv4.4.2) representation of LAI rather than the estimated LAI values just from BELD data. See https://github.com/USEPA/CMAQ/wiki/CMAQ-Release-Notes:-Emissions-Updates:-BEIS-Biogenic-Emissions for more technical information on BEIS4.
BEIS4 includes a two-layer canopy model. Layer structure varies with light intensity and solar zenith angle. Both layers of the canopy model include estimates of sunlit and shaded leaf area based on solar zenith angle and light intensity, direct and diffuse solar radiation, and leaf temperature [ref 1]. The new algorithm requires additional meteorological variables over previous versions of BEIS. The meteorology input data fields used by BEIS are shown in Table 7.2.
| Variable | Description |
|---|---|
| LAI | leaf-area index |
| PRSFC | surface pressure |
| Q2 | mixing ratio at 2 m |
| RC | convective precipitation per meteorological time step |
| RGRND | solar rad reaching surface |
| RN | non-convective precipitation per meteorological time step |
| RSTOMI | inverse of bulk stomatal resistance |
| SLYTP | soil texture type by USDA category |
| SOIM1 | volumetric soil moisture in top cm |
| SOIT1 | soil temperature in top cm |
| TEMPG | skin temperature at ground |
| USTAR | cell averaged friction velocity |
| RADYNI | inverse of aerodynamic resistance |
| TEMP2 | temperature at 2 m |
| WSAT_PX | soil saturation from (Pleim-Xiu Land Surface Model) PX-LSM |
The Biogenic Emissions Landcover Database version 6 (BELD6) was used as the input gridded land use information in generating 2023NEI estimates. The other input dataset change involved updating the dry leaf biomass (grams/m2) values for various vegetation types.
The BELD6 includes the following datasets:
High resolution tree species and biomass data from Wilson 2013a [ref 2] and Wilson 2013b [ref 3] for which species names were changed from non-specific common names to scientific names.
Tree species biogenic volatile organic carbon (BVOC) emission factors for tree species were taken from the NCAR Enclosure database (Wiedinmyer 2001).
Agricultural land use from US Department of Agriculture (USDA) crop data layer (https://www.nass.usda.gov/Research_and_Science/Cropland/SARS1a.php)
Global Moderate Resolution Imaging Spectroradiometer (MODIS) 20 category data with enhanced lakes and Fraction of Photosynthetically Active Radiation (FPAR) for vegetation coverage from National Center for Atmospheric Research (NCAR) (https://www2.mmm.ucar.edu/wrf/users/download/get_sources_wps_geog.html )
Canadian BELD land use (https://www.epa.gov/sites/default/files/2019-08/documents/800am_zhang_2_0.pdf).
The SMOKE-BEIS4 modeling system consists of two programs named: 1) Normbeis4 and 2) Tmpbeis4. Normbeis4 uses emissions factors and BELD6 landuse and gridded biomass data to compute gridded normalized emissions for chosen model domain (see Figure 7.4. The BEIS4 emissions factor file (BEISFAC) contains leaf-area-indices (LAI), dry leaf biomass, winter biomass factor, indicator of specific leaf weight, Agricultural land type Yes/No (AG_YN), and normalized emission fluxes for 35 different species/compounds. The BELD6 file is the gridded landuse for 200+ different landuse types. The output gridded domain is the same as the input domain for the land use data. Output emission fluxes (BEIS_NORM_EMIS) are normalized to 30°C, and isoprene and methyl-butenol fluxes are also normalized to a photosynthetic active radiation of 1000 µmol/m2s.
The normalized emissions output from Normbeis4 (BEIS_NORM_EMIS) are input into Tmpbeis4 along with the MCIP meteorological data, chemical speciation profile to use for desired chemical mechanism, and soil moisture data file. Figure 7.5 illustrates the data flows for the Tmpbeis4 program. The output from Tmpbeis includes gridded, speciated, hourly emissions both in moles/second (B4GTS_L) and tons/hour (B4GTS_S). Biogenic emissions output from Tmpbeis do not use an emissions inventory and do not have SCCs assigned Please see the SMOKEv5.1 User’s Manual for more information on BEIS4 ( https://cmascenter.org/smoke/documentation/5.1/html/ch04s19.html).
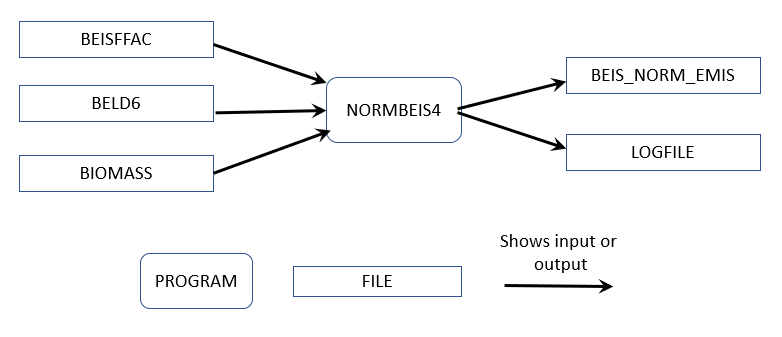
Figure 7.4: Normbeis4 data flows for 2023NEI
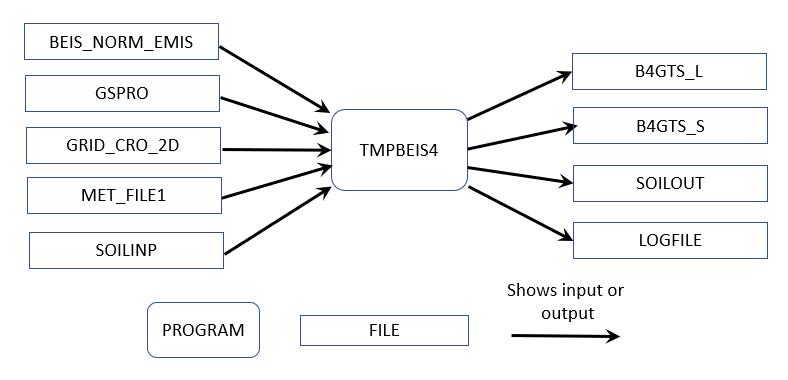
Figure 7.5: Tmpbeis4 data flow diagram for 2023NEI
7.1.2 Alaska, Hawaii, Puerto Rico and Virgin Islands
The 2023NEI also include biogenic emissions estimates for counties in the states of Alaska and Hawaii, and for the territories of Puerto Rico and Virgin Islands. The BEIS version 3.61 modeling system and WRFv4.4.2 meteorology data for year 2023 were used to produce gridded biogenic emissions for 3 separate modeling domains at 9-km horizontal resolution. BELD6 data was not available for these modeling domains so BEIS4 was not used for these states/territories. The modeling domain for Alaska is shown in Figure 7.6. The land use data used for generating input data for BEIS3.61 included the MODIS 20 category dataset, and the FIA version 8.0 used for estimating biomass input information.
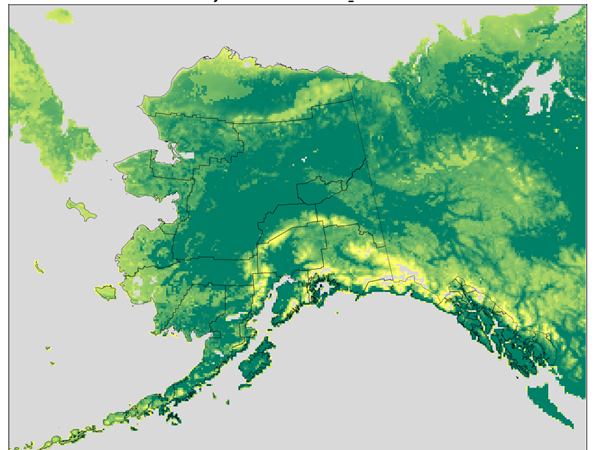
Figure 7.6: Alaska 9-km modeling domain
The modeling domains for Hawaii, Puerto Rico and Virgin Islands are shown in Figure 7.7 and Figure 7.8, respectively. Both Puerto Rico and Virgin Islands territories are in the same 9-km modeling domain. The MODIS 20 category land use dataset was the only dataset used for land use/vegetation input into BEIS3.61.
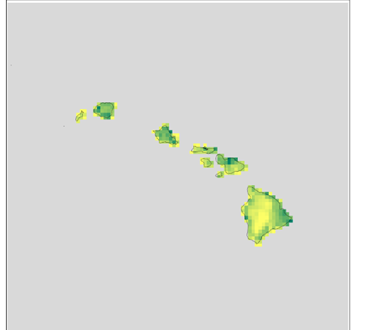
Figure 7.7: Hawaii 9-km modeling domain
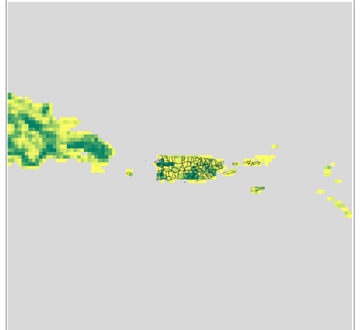
Figure 7.8: Puerto Rico and Virgin Islands 9-km modeling domain
The 9-kilometer gridded hourly data from these modeling domains are summed to monthly and annual level and are mapped from 9-kilometer grid cells to counties using a standard mapping file in a similar manner as was done for the contiguous 48 states. The mapping of BEIS species to NEI pollutants for these states and territories was also done in the same manner as the contiguous 48 states.