2.3 What are the sources of data in the 2020 NEI?
This section shows the contributions of S/L/T agency data to total emissions for the point and nonpoint data categories. Figure 2.2 shows the proportion of CAP, select HAPs, and HAP group emissions from various data sources in the NEI for point data category sources. Except for PM2.5 and PM10, most point CAP emissions come from S/L/T-submitted data. PM augmentation (see Section 2.2.4), which is based off incomplete S/L/T submittals of PM, accounts for a significant portion of PM point emissions. The data sources shown in the figure are described in more detail in Section 3.

Figure 2.2: Relative contributions for various data sources of Point emissions for CAPs and select HAPs
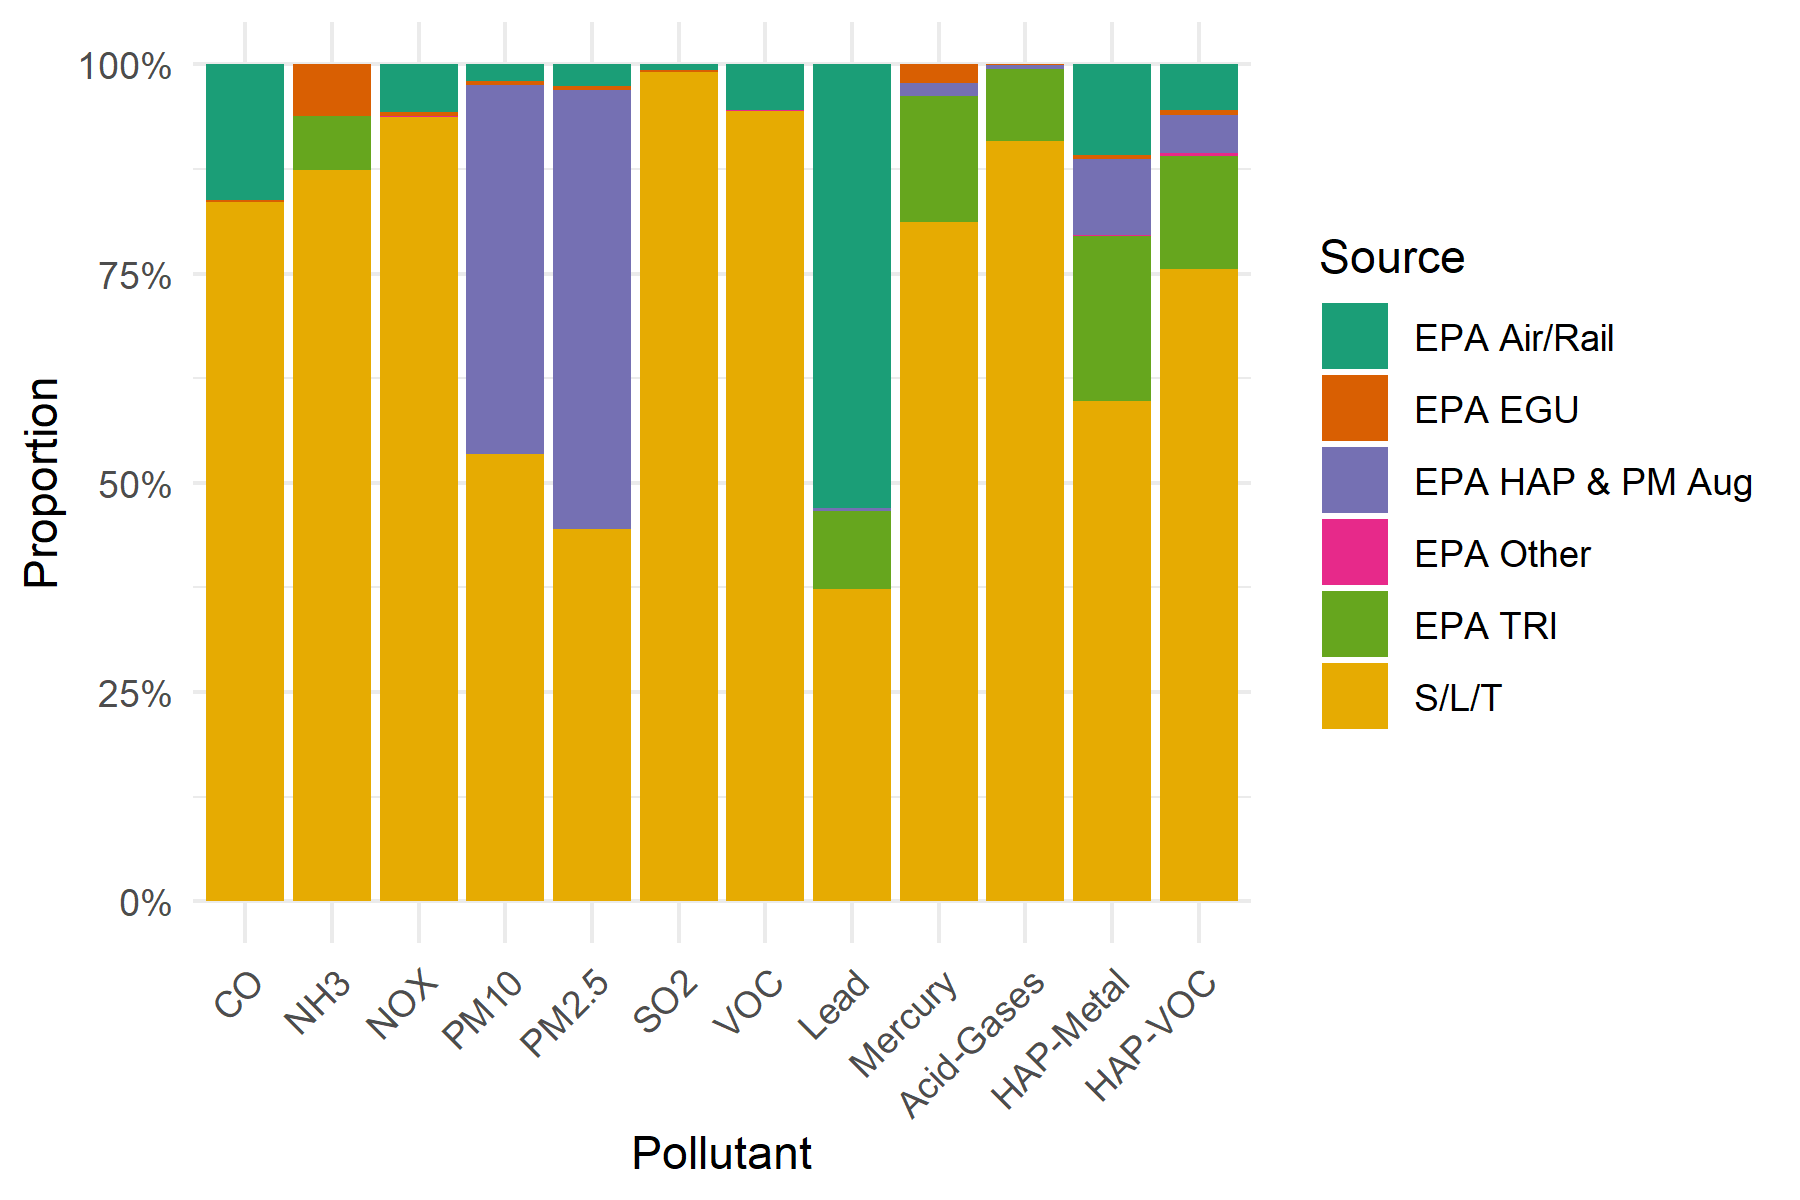
Figure 2 3 shows the proportion of CAP, select HAPs, and HAP group emissions from various data sources in the NEI for nonpoint data category sources. Biogenic sources, all EPA data, are not included in this table. Acid Gases include the following pollutants: hydrogen cyanide, hydrochloric acid, hydrogen fluoride, and chlorine. HAP VOC emissions consist of dozens of VOC HAP species, that in-aggregate, should be less than VOC in our QA checks. HAP metal emissions consist of the following compound groups: Antimony, Arsenic, Beryllium, Cadmium, Chromium, Cobalt, Lead, Manganese, Mercury, Nickel and Selenium. More than 50% of nonpoint pollutant totals come from some type of EPA source; however, as discussed in Section 6, S/L/T-submitted nonpoint activity data is absorbed into EPA nonpoint tools and are therefore classified as “EPA” data. Nonpoint NH3 is dominated by the agricultural livestock waste and fertilizer application sectors. The large “EPA Nonpoint” bars for PM10 and PM2.5 are predominantly dust sources from unpaved roads, agricultural dust from crop cultivation, and construction dust.
We did not compute relative contributions of emissions from nonroad and onroad data categories because of the nature in how emissions are created for these sources -via a mix of S/L/T and EPA activity data and processed through the MOVES model. California, which uses its own onroad and nonroad mobile models, was the only state that provided emissions rather than inputs for EPA models (this is in accordance with the AERR). All other states were required to provide inputs to the EPA models. Onroad and nonroad mobile data categories use the MOVES emissions model, and the EPA primarily collected model inputs from S/L agencies for these categories and ran the models using these inputs to generate the emissions. The S/L agencies that provided inputs are presented in the nonroad and onroad portions of the document, Section 4 and Section 5, respectively.