8.2 EPA-developed estimates
8.2.1 Methodology Overview
The approach to calculating NH3 emissions from agricultural lands in 2023 is consistent with the 2020 NEI, however, in the 2023 NEI, agricultural land emissions were tabulated separately from the non-agricultural land biogenic NH3 emissions based on the National Land Cover Database (NLCD) agricultural land use fraction data from the driving meteorological model. The bidirectional (“bidi”) version of CMAQ (v5.4) [ref 1] and the Fertilizer Emissions Scenario Tool for CMAQ (FEST-C; v1.4) [ref 2] were used to estimate NH3 emissions from cropland soils. The estimates are specific to the Biogenic Emissions Landuse Dataset (BELD4) simulated land use category and are scaled based on the percent areal coverage in each grid cell of that category (e.g., “Hay” or “Alfalfa”). These estimates were then loaded into EIS for use in the 2023 NEI. In summary, the approach to estimate 2023 agricultural land emissions consists of these steps:
- Run FEST-C to produce nitrate (NO3), ammonium (NH4+, including urea), and organic (manure) nitrogen (N) fertilizer usage estimates.
- Run CMAQ v 5.4 model with the Surface Tiled Aerosol and Gaseous Exchange (STAGE) deposition option, which includes bidirectional NH3 exchange to generate gaseous NH3 fertilizer application emission estimates.
- Calculate county-level emission factors as the ratio of bidirectional CMAQ NH3 fertilizer emissions to FEST-C total N fertilizer application.
- Assign the NH3 agricultural land emissions to SCC: 2801700100.
FEST-C is a software program that processes land use and agricultural activity data to develop inputs for the CMAQ model when run with bidirectional exchange. FEST-C reads land use data from the BELD4, meteorological variables from the Weather Research and Forecasting (WRF) model [ref 3], and nitrogen deposition data from a previous or historical average CMAQ simulation. FEST-C then uses the USDA’s Environmental Policy Integrated Climate (EPIC) modeling system [ref 4] to simulate the agricultural practices and soil biogeochemistry and provides information regarding fertilizer timing, composition, application method and amount. Figure 8.1 below provides a comprehensive flowchart of the complete EPIC/FEST-C bidirectional modeling system.
For 2023, we estimate fertilizer application by crop type for 2023 using FEST-C modeled data since 2023 USDA Economic Research Service crop-specific fertilization data is not yet available, and we did not receive state estimated data. In the future, the FEST-C simulations could be evaluated using the USDA Economic Research Service and U.N Food and Agriculture national fertilizer application estimates.
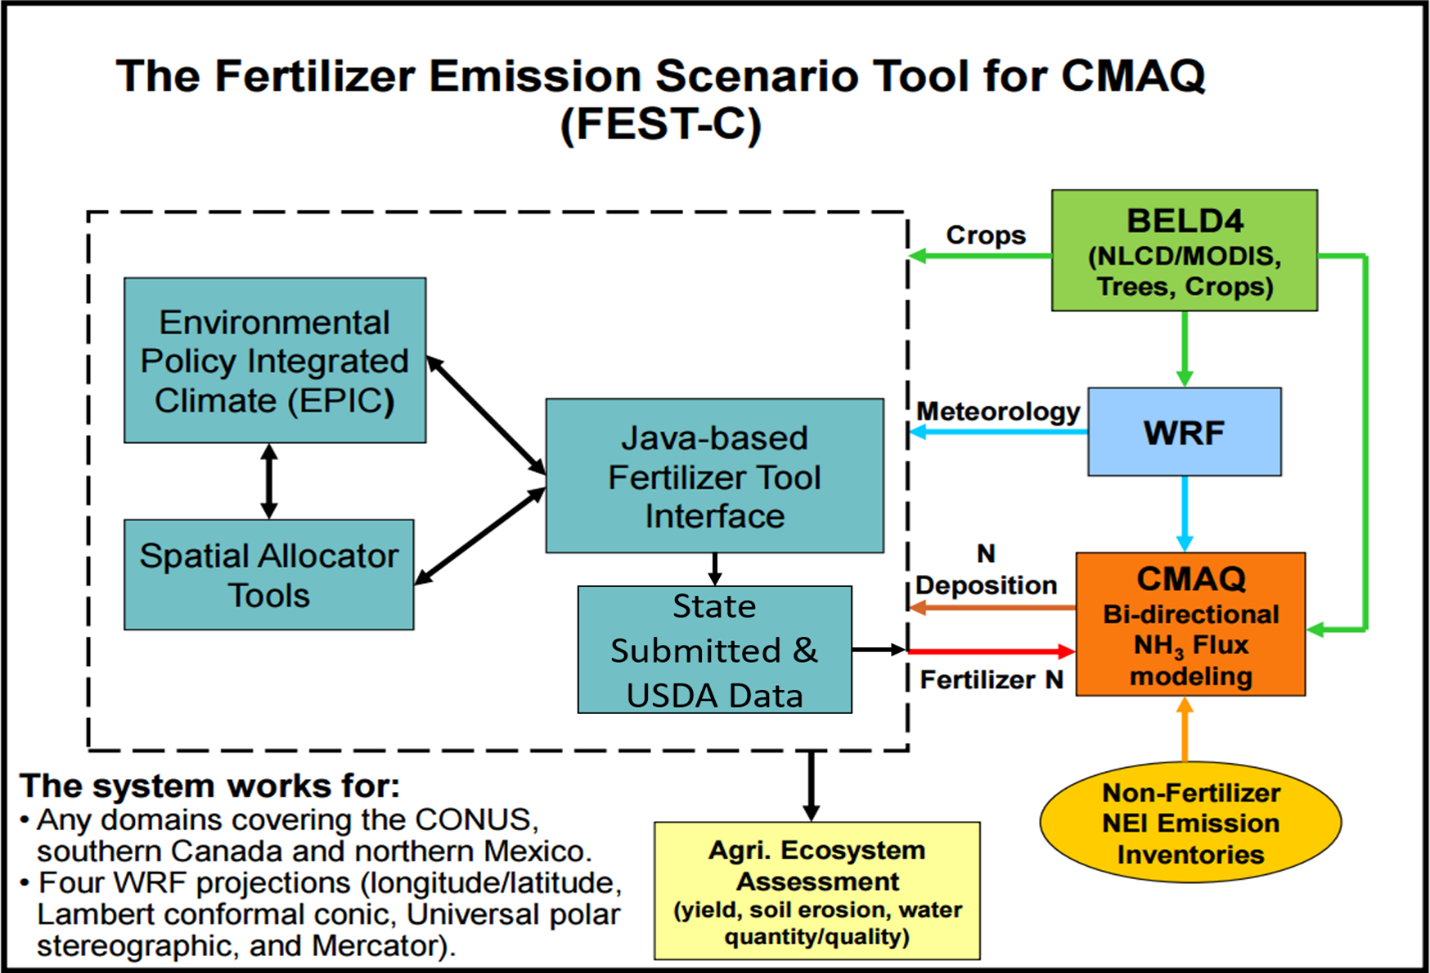
Figure 8.1: Bidirectional modeling system used to compute 2023 agricultural land emissions
The following activity parameters were input into the EPIC model:
- Meteorology from WRF model (WRF)
- Initial soil profiles/soil selection
- Presence of 21 major crops, with each either irrigated or rain-fed: hay, alfalfa, grass, barley, beans, grain and forage corn, grain and forage cotton, oats, peanuts, potatoes, rice, rye, grain and forage sorghum, soybeans, grain and forage wheat, canola, and other grain and forage crops (e.g. lettuce, tomatoes, etc.).
- Fertilizer sales to establish the type/composition of nutrients applied
- Management scenarios for the 10 USDA production regions in Figure 8.2 [ref 5]. These include irrigation, tile drainage, intervals between forage harvest, fertilizer application method (injected versus surface applied), and equipment commonly used in these production regions.
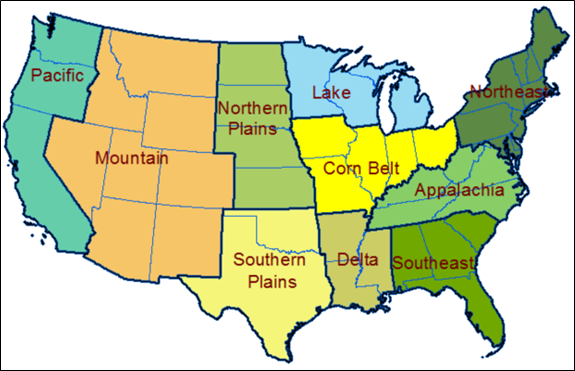
Figure 8.2: USDA farm production regions used in FEST-C simulations
WRF v4.6 simulations were processed with the Meteorology-Chemistry Interface Processor (MCIP) version 5.3.3. MCIP output provides grid cell meteorology for 2023 using a national 12-km rectangular grid covering the continental U.S. More information on MCIP is available here: https://www.epa.gov/cmaq/meteorology-chemistry-interface-processor. The meteorological parameters in Table 8.2 below were used as EPIC model inputs.
| EPIC input variable | Variable Source |
|---|---|
| Daily Total Radiation (MJ m2) | WRF/MCIP |
| Daily Maximum 2-m Temperature (C) | WRF/MCIP |
| Daily minimum 2-m temperature (C) | WRF/MCIP |
| Daily Total Precipitation (mm) | WRF/MCIP |
| Daily Average Relative Humidity (unitless) | WRF/MCIP |
| Daily Average 10-m Wind Speed (m s-1) | WRF/MCIP |
| Daily Total Wet Deposition Oxidized N (g/ha) | CMAQ |
| Daily Total Wet Deposition Reduced N (g/ha) | CMAQ |
| Daily Total Dry Deposition Oxidized N (g/ha) | CMAQ |
| Daily Total Dry Deposition Reduced N (g/ha) | CMAQ |
| Daily Total Wet Deposition Organic N (g/ha) | CMAQ |
Initial soil nutrient and pH conditions in EPIC are based on a USDA Soil Conservation Service Soils-5 survey [ref 6]. Following a spin-up period to generate initial soils conditions, the EPIC model then is run using current fertilization and agricultural cropping techniques to estimate soil nutrient content and pH for the 2023 WRF-CMAQ simulation.
The presence of crops in each model grid cell was determined using USDA Census of Agriculture data [ref 7] and USGS National Land Cover data [ref 8]. These two data sources were used to compute the fraction of agricultural land in a model grid cell and the mix of crops grown on that land.
Fertilizer sales data and the 6-month period in which they were sold were extracted from the Association of American Plant Food Control Officials (AAPFCO) [ref 9]. AAPFCO data are used to identify the composition (e.g. urea, nitrate, organic) of the fertilizer used, and the amount applied is estimated using the modeled crop demand. These data are used to assign what kind of fertilizer is being applied to which crops.
8.2.2 Activity Data
There were four different types of activity data used to estimate emissions. These were plant date (day of year), yield of grain or forage (ton/ha) and fertilization rates (kg/ha), which were obtained from the EPIC model. All activity data was at the state level and were provided to our stakeholders to enable review and comment during the 2023 NEI process. The data covered 10 USDA production regions and provides management schemes for hay, alfalfa, grass, barley, beans, grain and forage corn, grain and forage cotton, oats, peanuts, potatoes, rice, rye, grain and forage sorghum, soybeans, grain and forage wheat, canola, and other grain and forage crops (e.g. lettuce, tomatoes, etc.).
8.2.3 Emission Factors
The emission factors were derived from the 2023 CMAQ FEST-C outputs. Total agricultural land emission factors for each month and county were computed by taking the ratio of total agricultural land NH3 emissions (short tons) to total nitrogen fertilizer application (short tons).
Gridded NH3 emissions on a 12 km by 12 km scale were mapped to a county shape file polygon. The cell was assigned to a county if the grid centroid fell within the county boundary. County-level agricultural land emissions (NH3) are derived from the diagnostic emission output from the CMAQ FEST-C model simulation (for details see [ref 10]). With this modeling system, it would be difficult to perform a sample calculation; this is not something that could be demonstrated in a spreadsheet. These emissions are computed via the full chemical transport model with a bidirectional deposition parameterization, as illustrated in Figure 8.3.
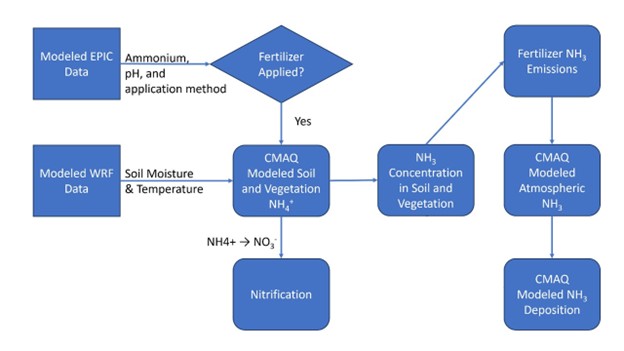
Figure 8.3: Modeling framework flow of operations in estimating agricultural land NH3 emissions. Agricultural land NH3 emissions are used by regional chemical transport models, such as CMAQ and CAMx, and are the sole option if the model is configured with a unidirectional depositional framework.